Gold, Silver, Copper Daily Forecast: U.S. Labor Data Spurs Price Dip
NEW YORK (December 11) Gold prices dipped below $2,000 per ounce in Asian trade on Monday, reacting to strong U.S. labor market data which dampened expectations of an early Federal Reserve rate cut in 2024.
This fall marks a significant decline from last week’s record highs. The outlook for gold remains cautious ahead of the Fed meeting, where rate decisions will be critical. The strong labor market has reduced the likelihood of a March rate cut, affecting gold’s attractiveness as risk appetite improves.
Meanwhile, copper prices also fell, influenced by China’s disinflationary trends signaling potential economic weakness, despite recent robust copper imports. These developments impact the investment appeal of these metals, with higher interest rates and economic conditions playing key roles.
Gold Prices Forecast
Gold – Chart
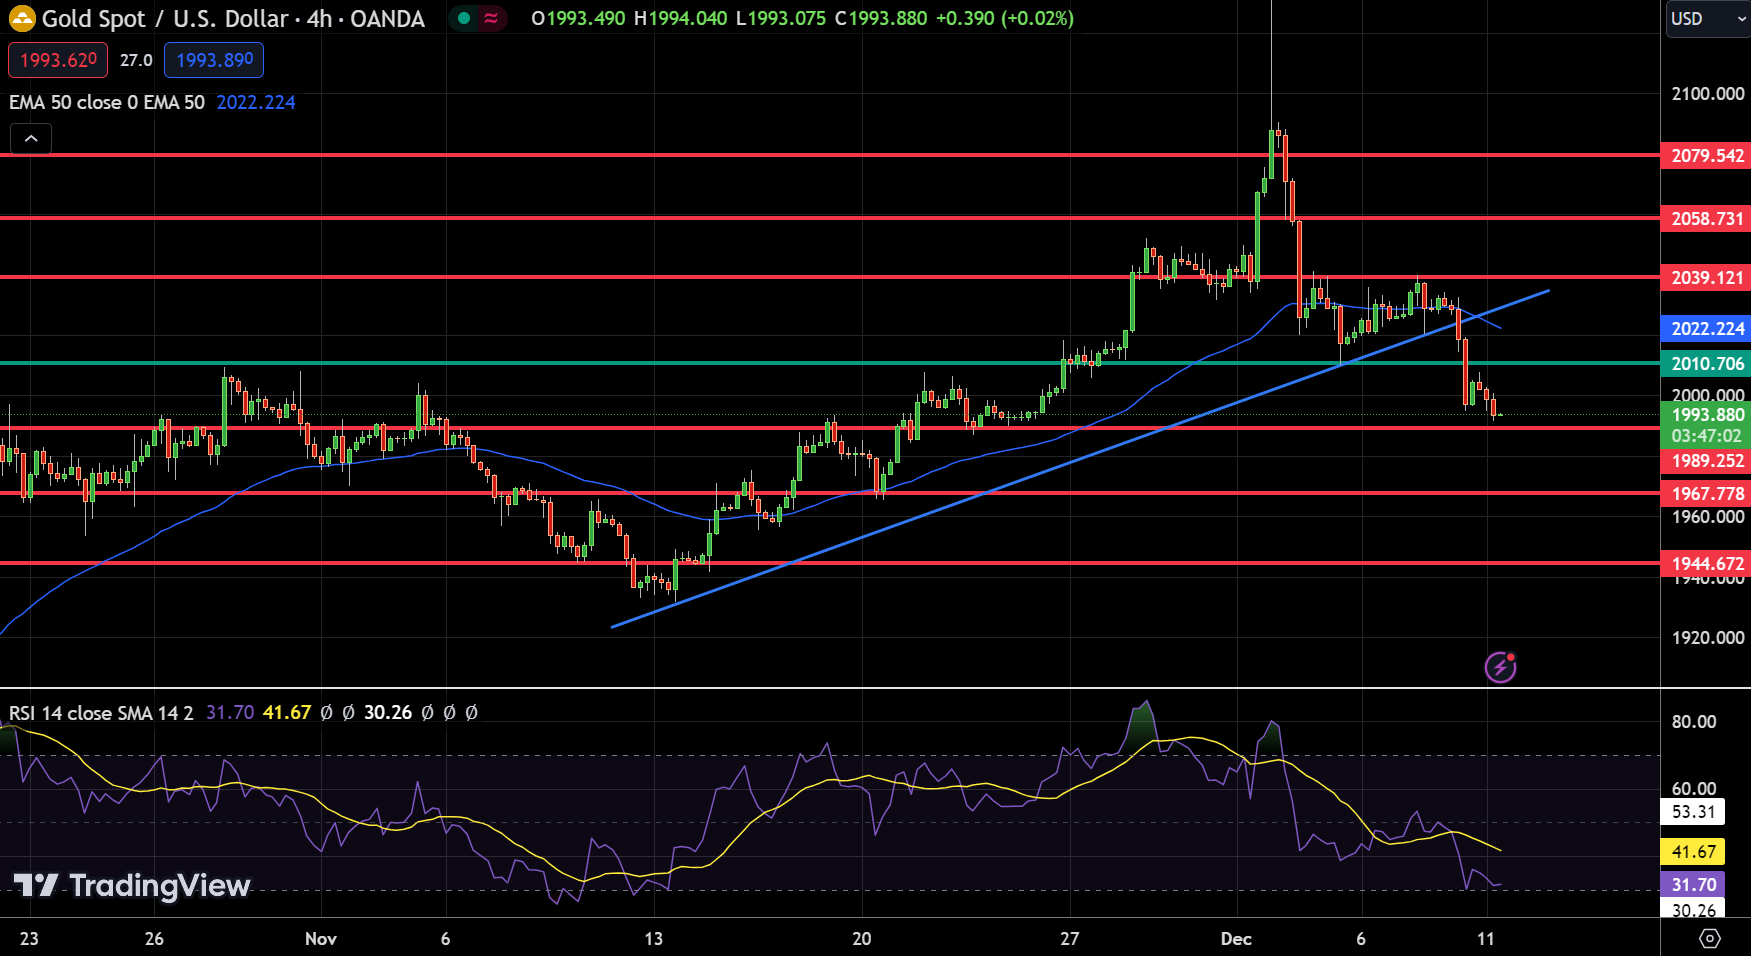
Gold’s recent trading trajectory has exhibited a downturn, currently standing at $1,993, reflecting a 0.51% decline. The precious metal is now navigating through a critical phase, as highlighted by its current position relative to the pivotal $2,010 mark.
Key resistance levels are set at $2,039, $2,058, and $2,079, which could potentially limit upward movements. Support levels, conversely, are established at $1,989, $1,967, and $1,944, providing a cushion against further declines.
The Relative Strength Index (RSI), hovering at 31, suggests that gold is nearing oversold conditions, while the MACD, at -3.255, indicates bearish momentum as it trails below its signal line. Additionally, the price is currently under the 50-day Exponential Moving Average (EMA) of $2,022, reinforcing the bearish outlook.
A notable technical observation is the violation of the double bottom pattern at the $2,010 resistance level, coupled with an upward trendline breakout, signaling a selling bias. Overall, the trend for gold appears bearish below the $2,010 threshold, with the market likely to test lower support levels in the near future.
Silver Prices Forecast
Silver – chart
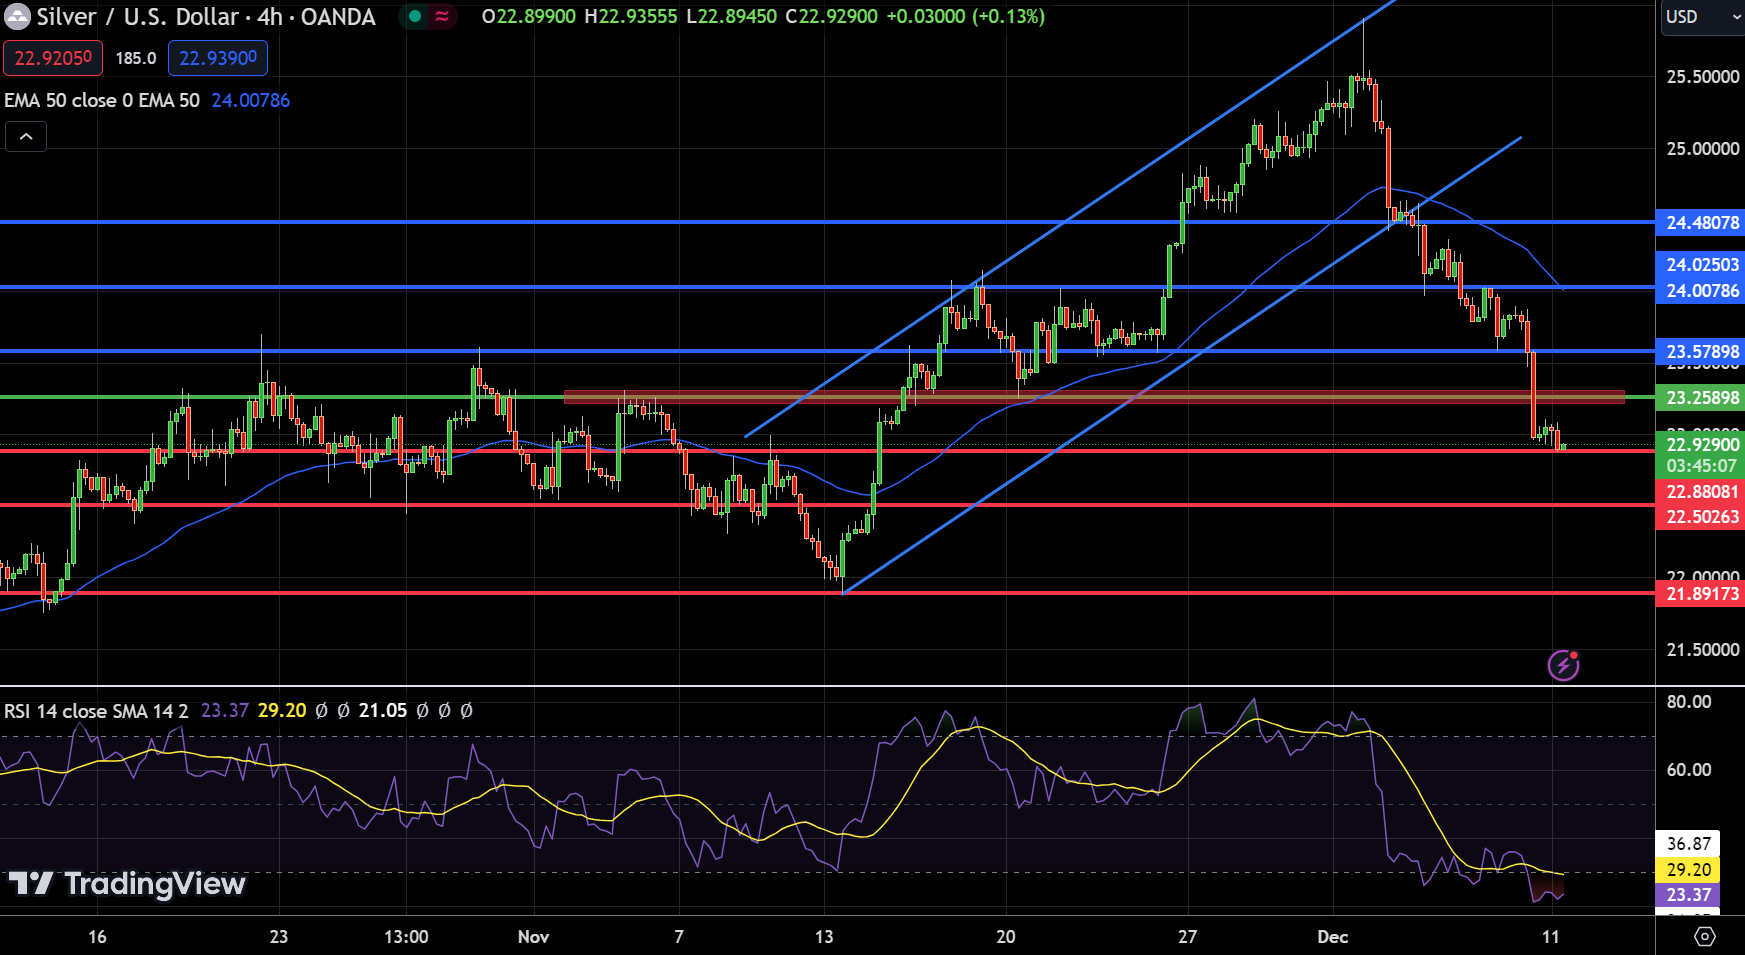
Silver’s current market position reflects a subtle downturn, with its price at $22.92, marking a 0.34% decline. The metal’s trajectory is currently wavering around the pivotal point of $23.26. In terms of resistance, key levels are identified at $23.58, $24.03, and $24.48, which could pose challenges for any upward trends.
On the flip side, support levels are established at $22.88, $22.50, and $21.89, offering potential buffers against downward price movements. The Relative Strength Index (RSI) stands at 23, suggesting that silver might be in an oversold territory, while the MACD at -0.057, trailing below its signal line, indicates a potential bearish trend.
A significant technical observation is the breach of the double bottom pattern at $23.25, hinting at a possible shift towards a selling bias. Overall, the current trend for silver leans bearish below the $23.25 mark, with expectations of the metal testing its resistance levels in the near term, subject to broader market influences.
Copper Prices Forecast
Copper – Chart
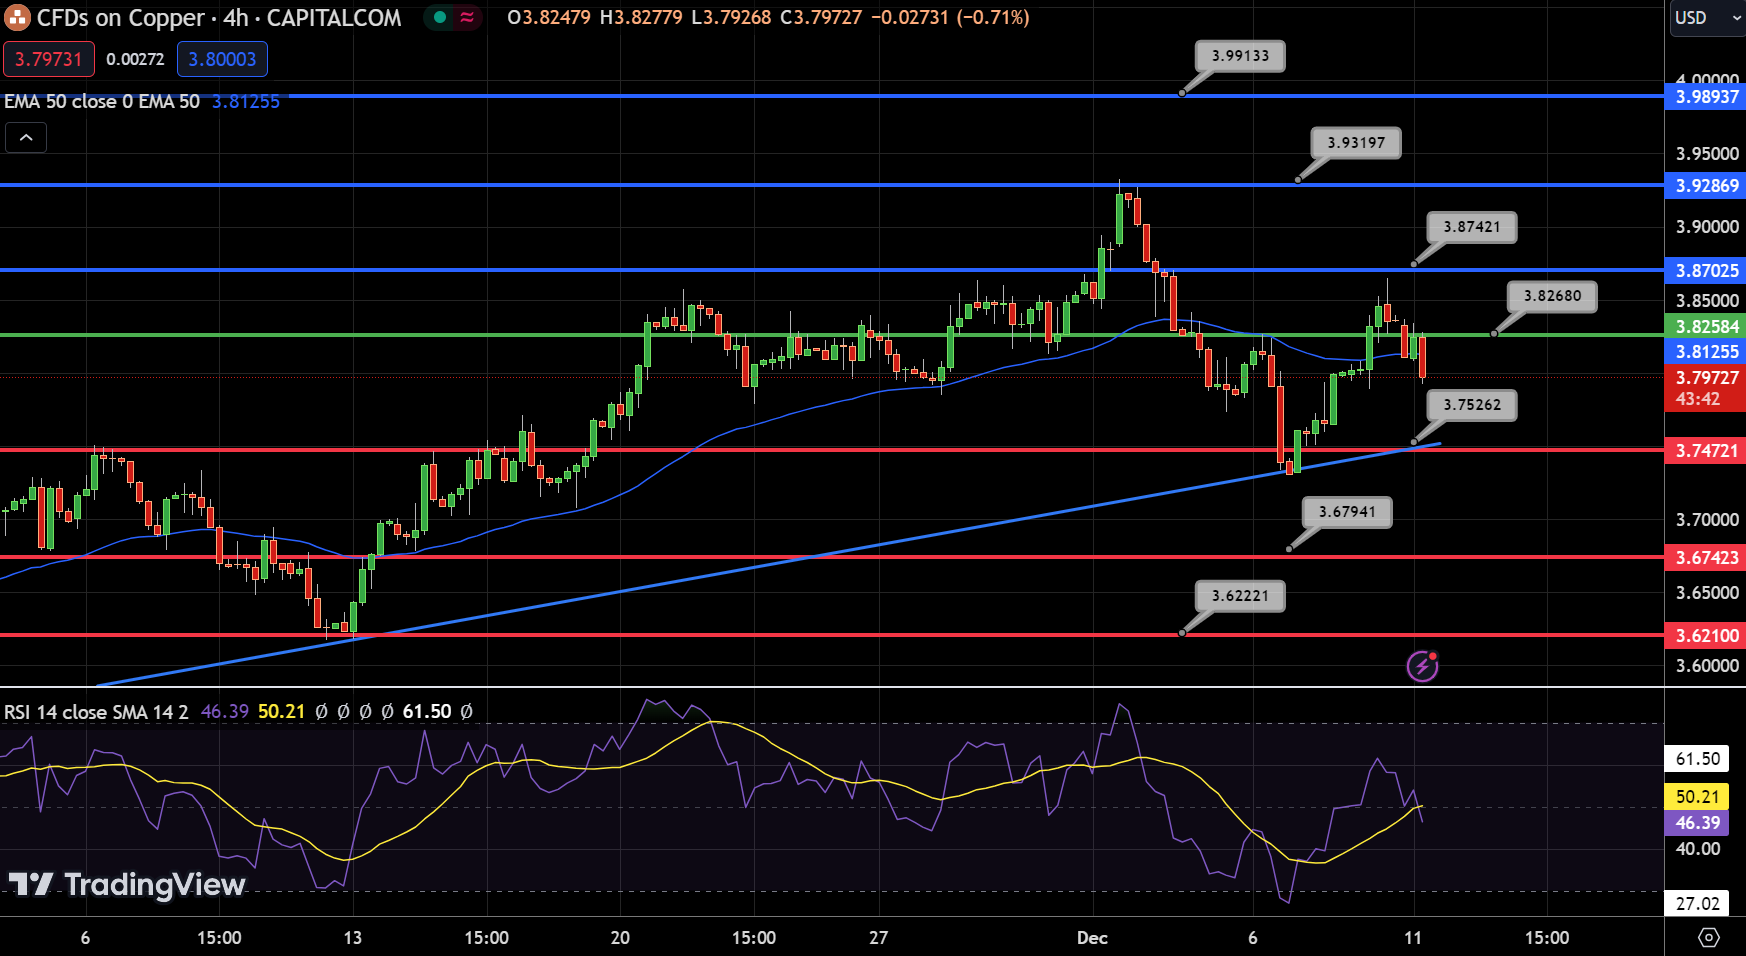
Copper’s market stance appears bearish as it trades at $3.79727, marking a 1% decline. The metal’s technical landscape, outlined on the 4-hour chart, shows a key pivot point at $3.83. Copper faces immediate resistance at $3.87, with further hurdles at $3.93 and $3.99. Support levels are identified at $3.75 and $3.68, with a significant lower support at $3.62, possibly arresting further declines.
The Relative Strength Index (RSI) stands at 46, indicating a bearish sentiment without extreme oversold conditions. The MACD, currently at zero, closely aligns with its signal line, suggesting potential shifts in momentum. Notably, the price has crossed below the 50-day Exponential Moving Average (EMA) of $3.81, reinforcing the bearish outlook. A bearish crossover on the 50 EMA suggests a selling trend may dominate below the $3.80 threshold.
In conclusion, Copper’s overall trend remains bearish below the crucial mark of $3.83. The market’s trajectory in the near term could be shaped by the ability to break through resistance levels or a further slip below current support points.
FXEmpire


