Gold and Silver Technical Analysis: XAUUSD and XAGUSD Supported by Rate Cut Expectations
LONDON (August 18) Gold and silver are consolidating near key levels, with XAUUSD holding between $3,250–$3,450 and XAGUSD maintaining bullish momentum above $35, while a weakening U.S. Dollar Index below 97.50 could further boost safe-haven demand.
Gold (XAUUSD) prices are consolidating below $3,450 despite a strong US retail sales report. The US dollar is weakening and sentiment is fading, while gold remains supported within a tight $3,330–$3,350 range.
The US Dollar Index dropped to 97.83, even as US Treasury yields rebounded. The chart below shows US Treasury note yields consolidating within the 4.0% to 4.6% range. The combination of weaker sentiment and rising inflation expectations is limiting dollar strength.
Moreover, the geopolitical developments are adding another layer of support. Trump’s meeting with Zelenskiy and European leaders has raised hopes for progress on a peace deal with Russia. These talks inject uncertainty into markets and benefit gold.
Meanwhile, markets expect the Fed to cut rates in September, with another cut possible by year-end. A lower interest-rate environment strengthens gold’s appeal. If prices hold above $3,250, the bullish momentum could extend further in the coming weeks.
Gold Technical Analysis
XAUUSD Daily Chart – Consolidation
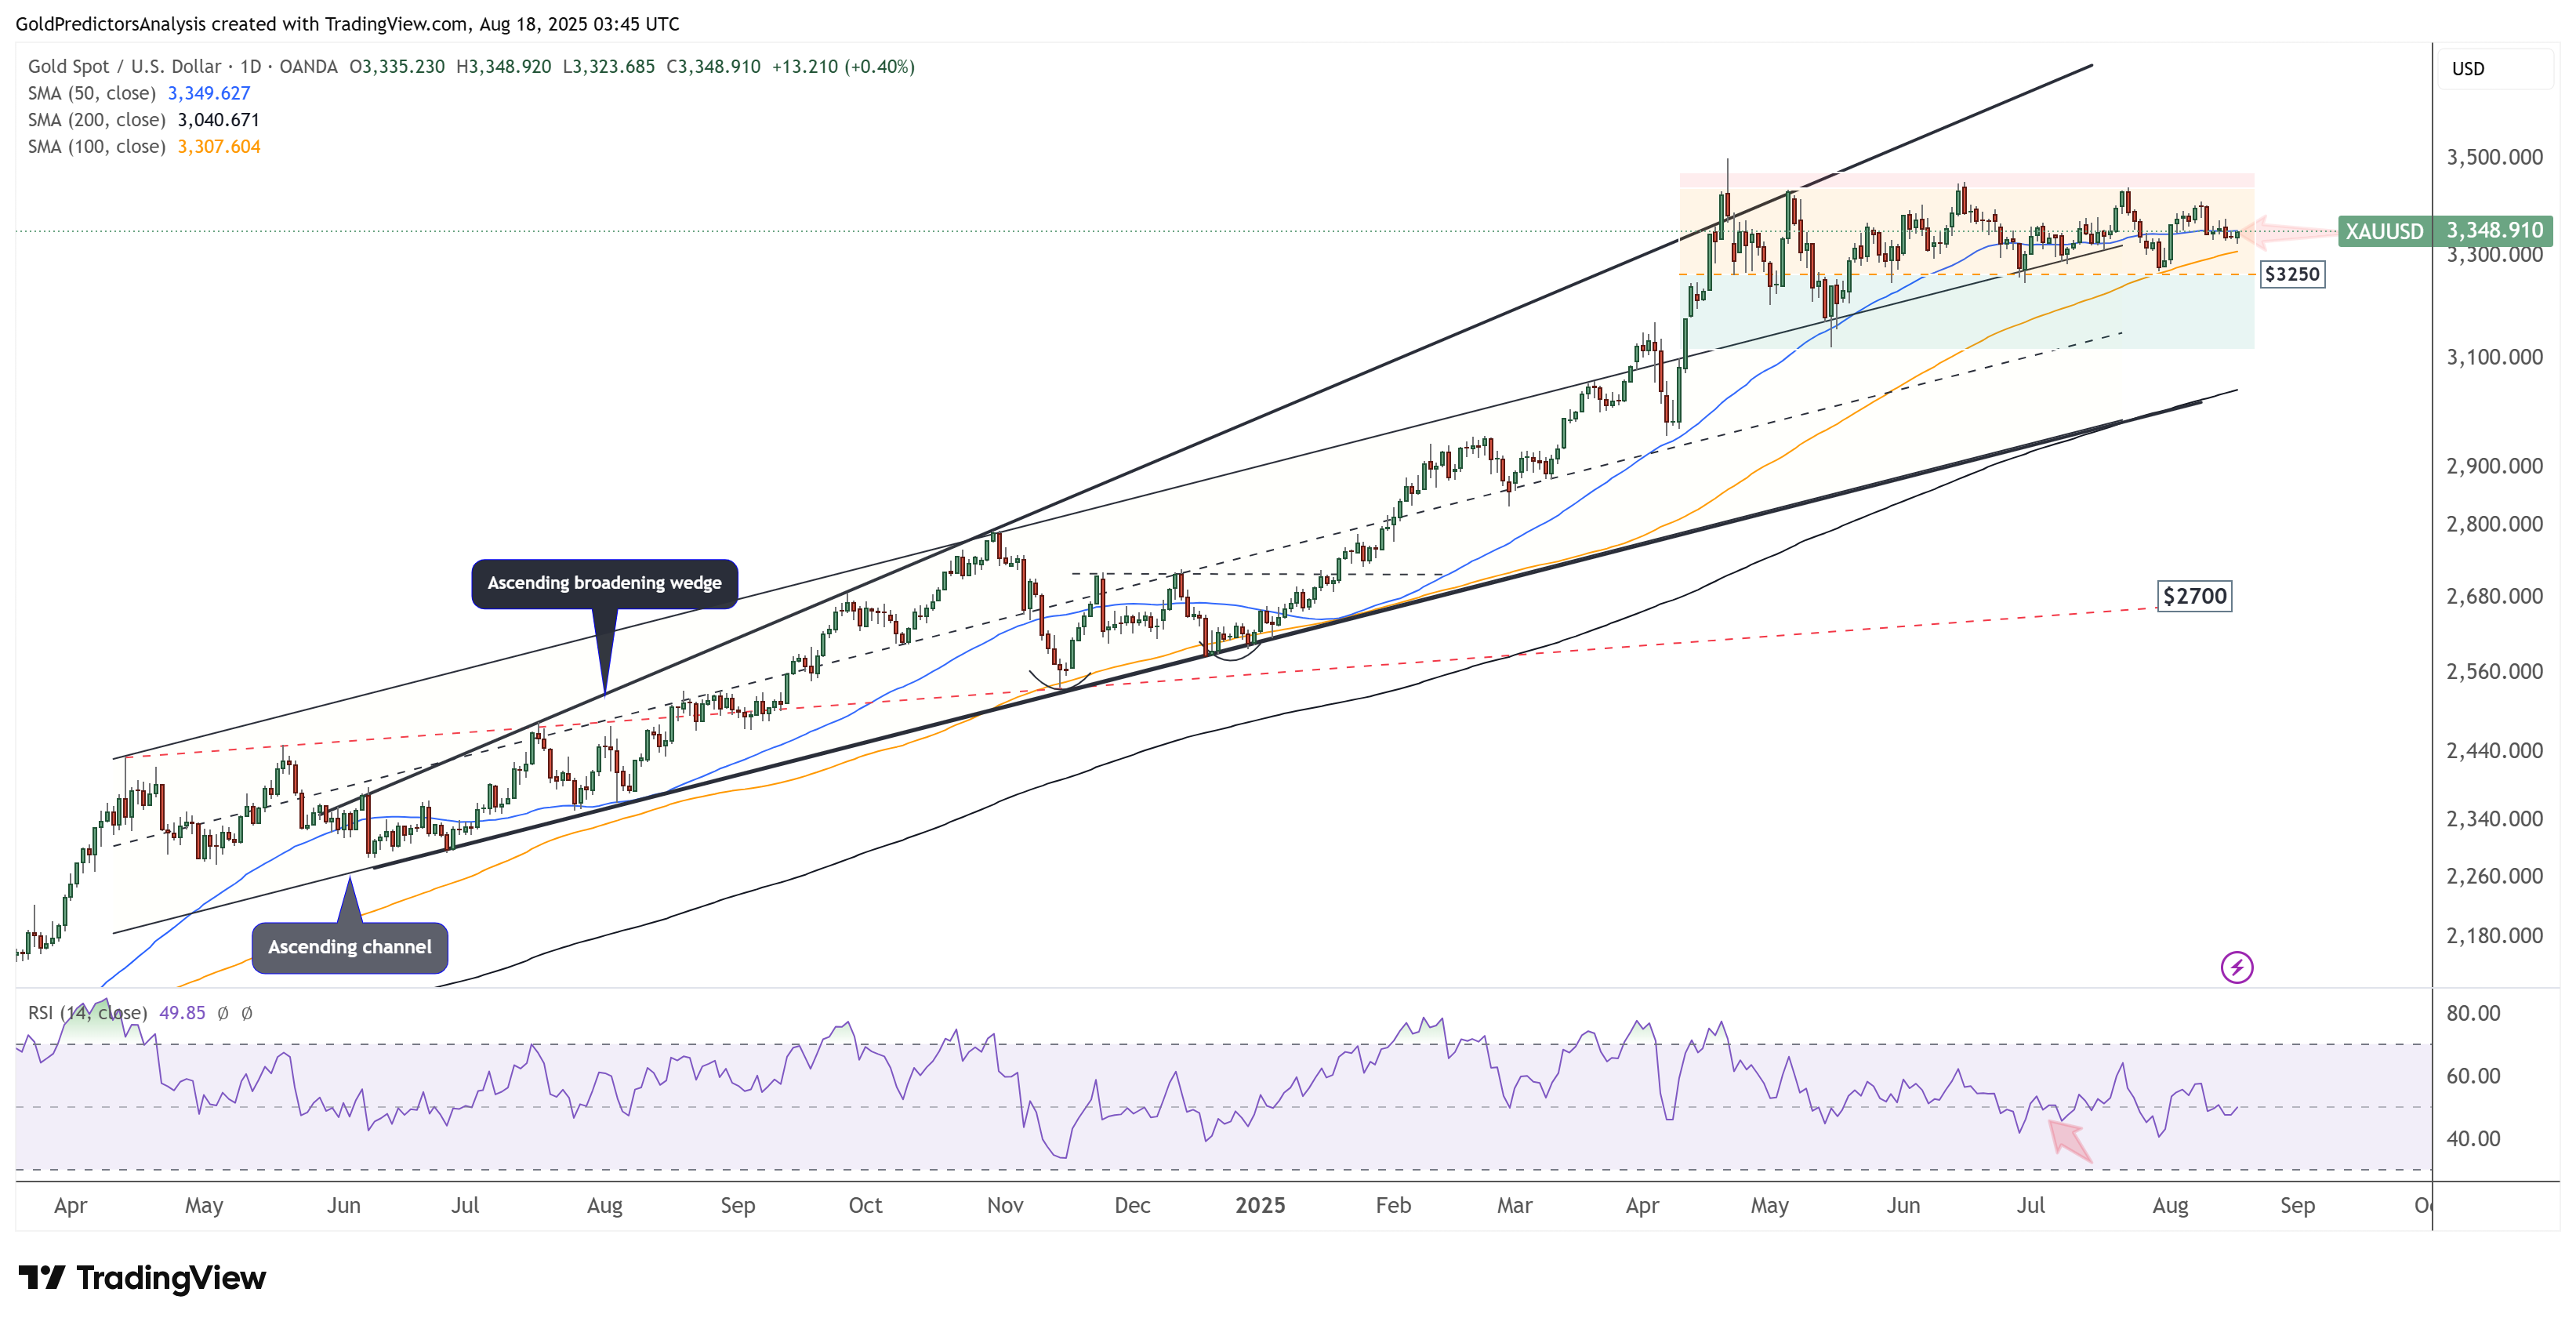
The daily chart for spot gold shows that the price is consolidating within the orange zone, above the 100-day SMA. The consolidation between $3,250 and $3,450 increases the possibility of an upside breakout. A move above $3,450 toward the $3,500 area could trigger a strong rally in gold prices.
On the other hand, a push below $3,250 would provide a strong buying opportunity within the green zone highlighted in the chart. In the short term, the direction for spot gold remains uncertain, and the next decisive move is likely to set the tone for the broader market.
XAUUSD 4-Hour Chart – Consolidation
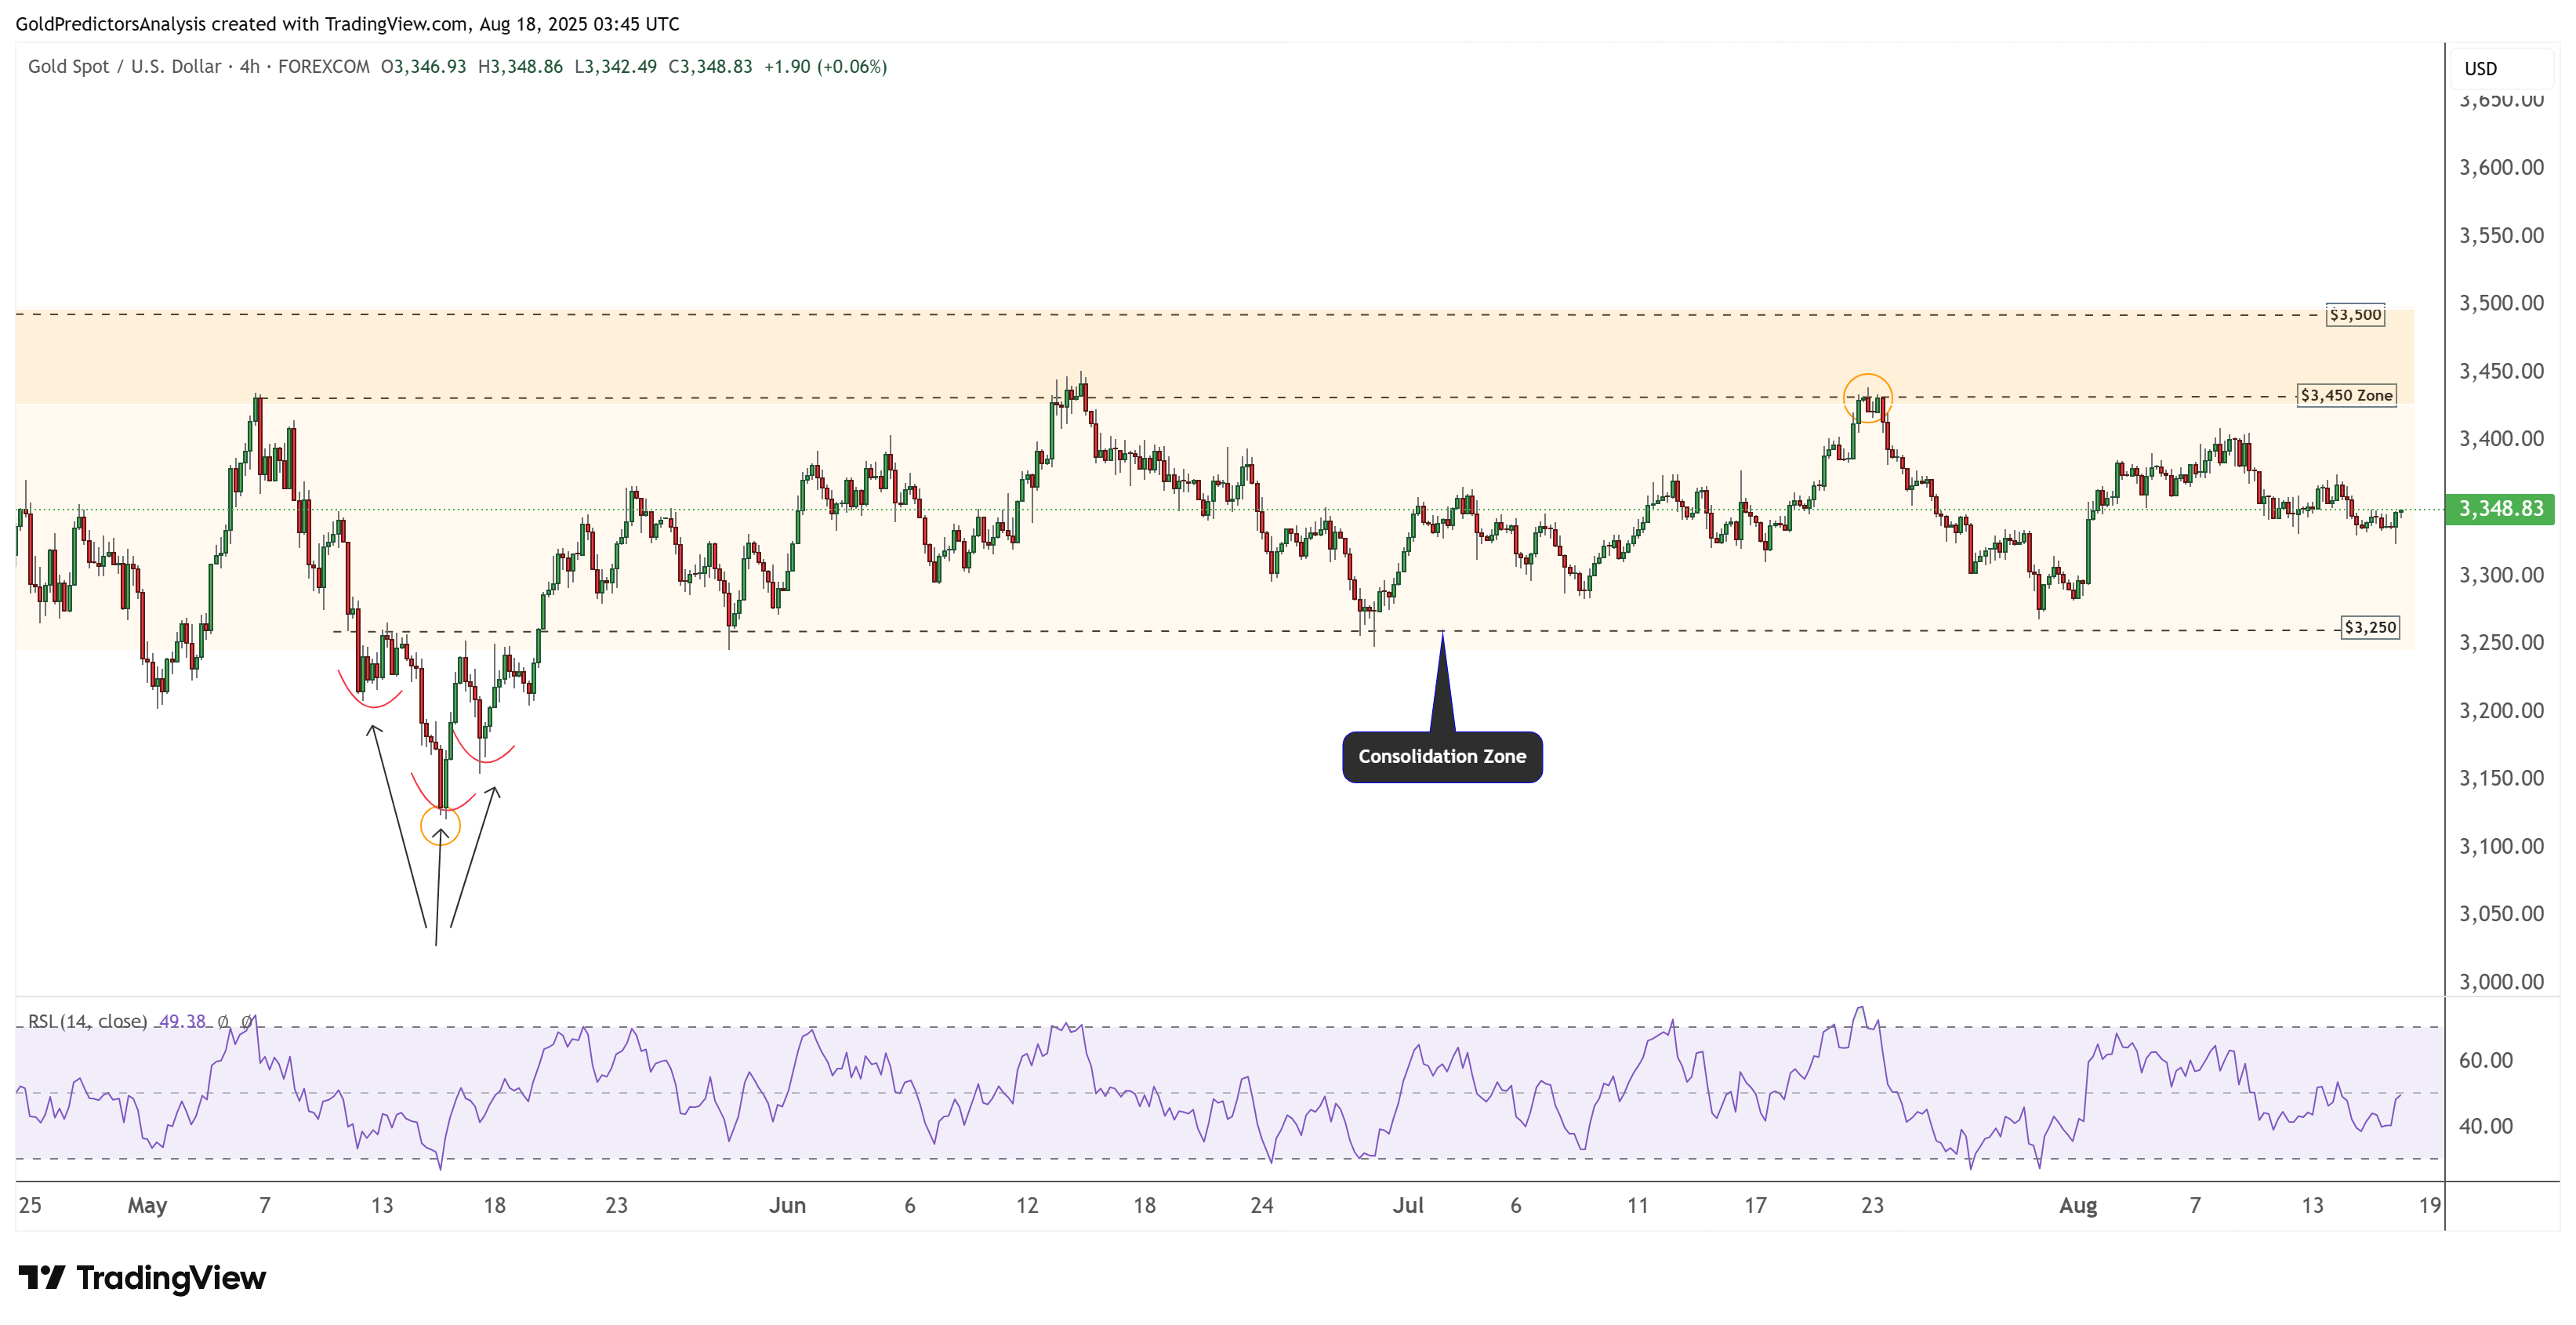
The 4-hour chart for spot gold shows consolidation within the $3,250–$3,450 zone. A break above $3,450 would open the way toward $3,500. Conversely, a drop below $3,250 would be bearish and could target the $3,150 level.
Silver Technical Analysis
XAGUSD Daily Chart – Bullish Reversal
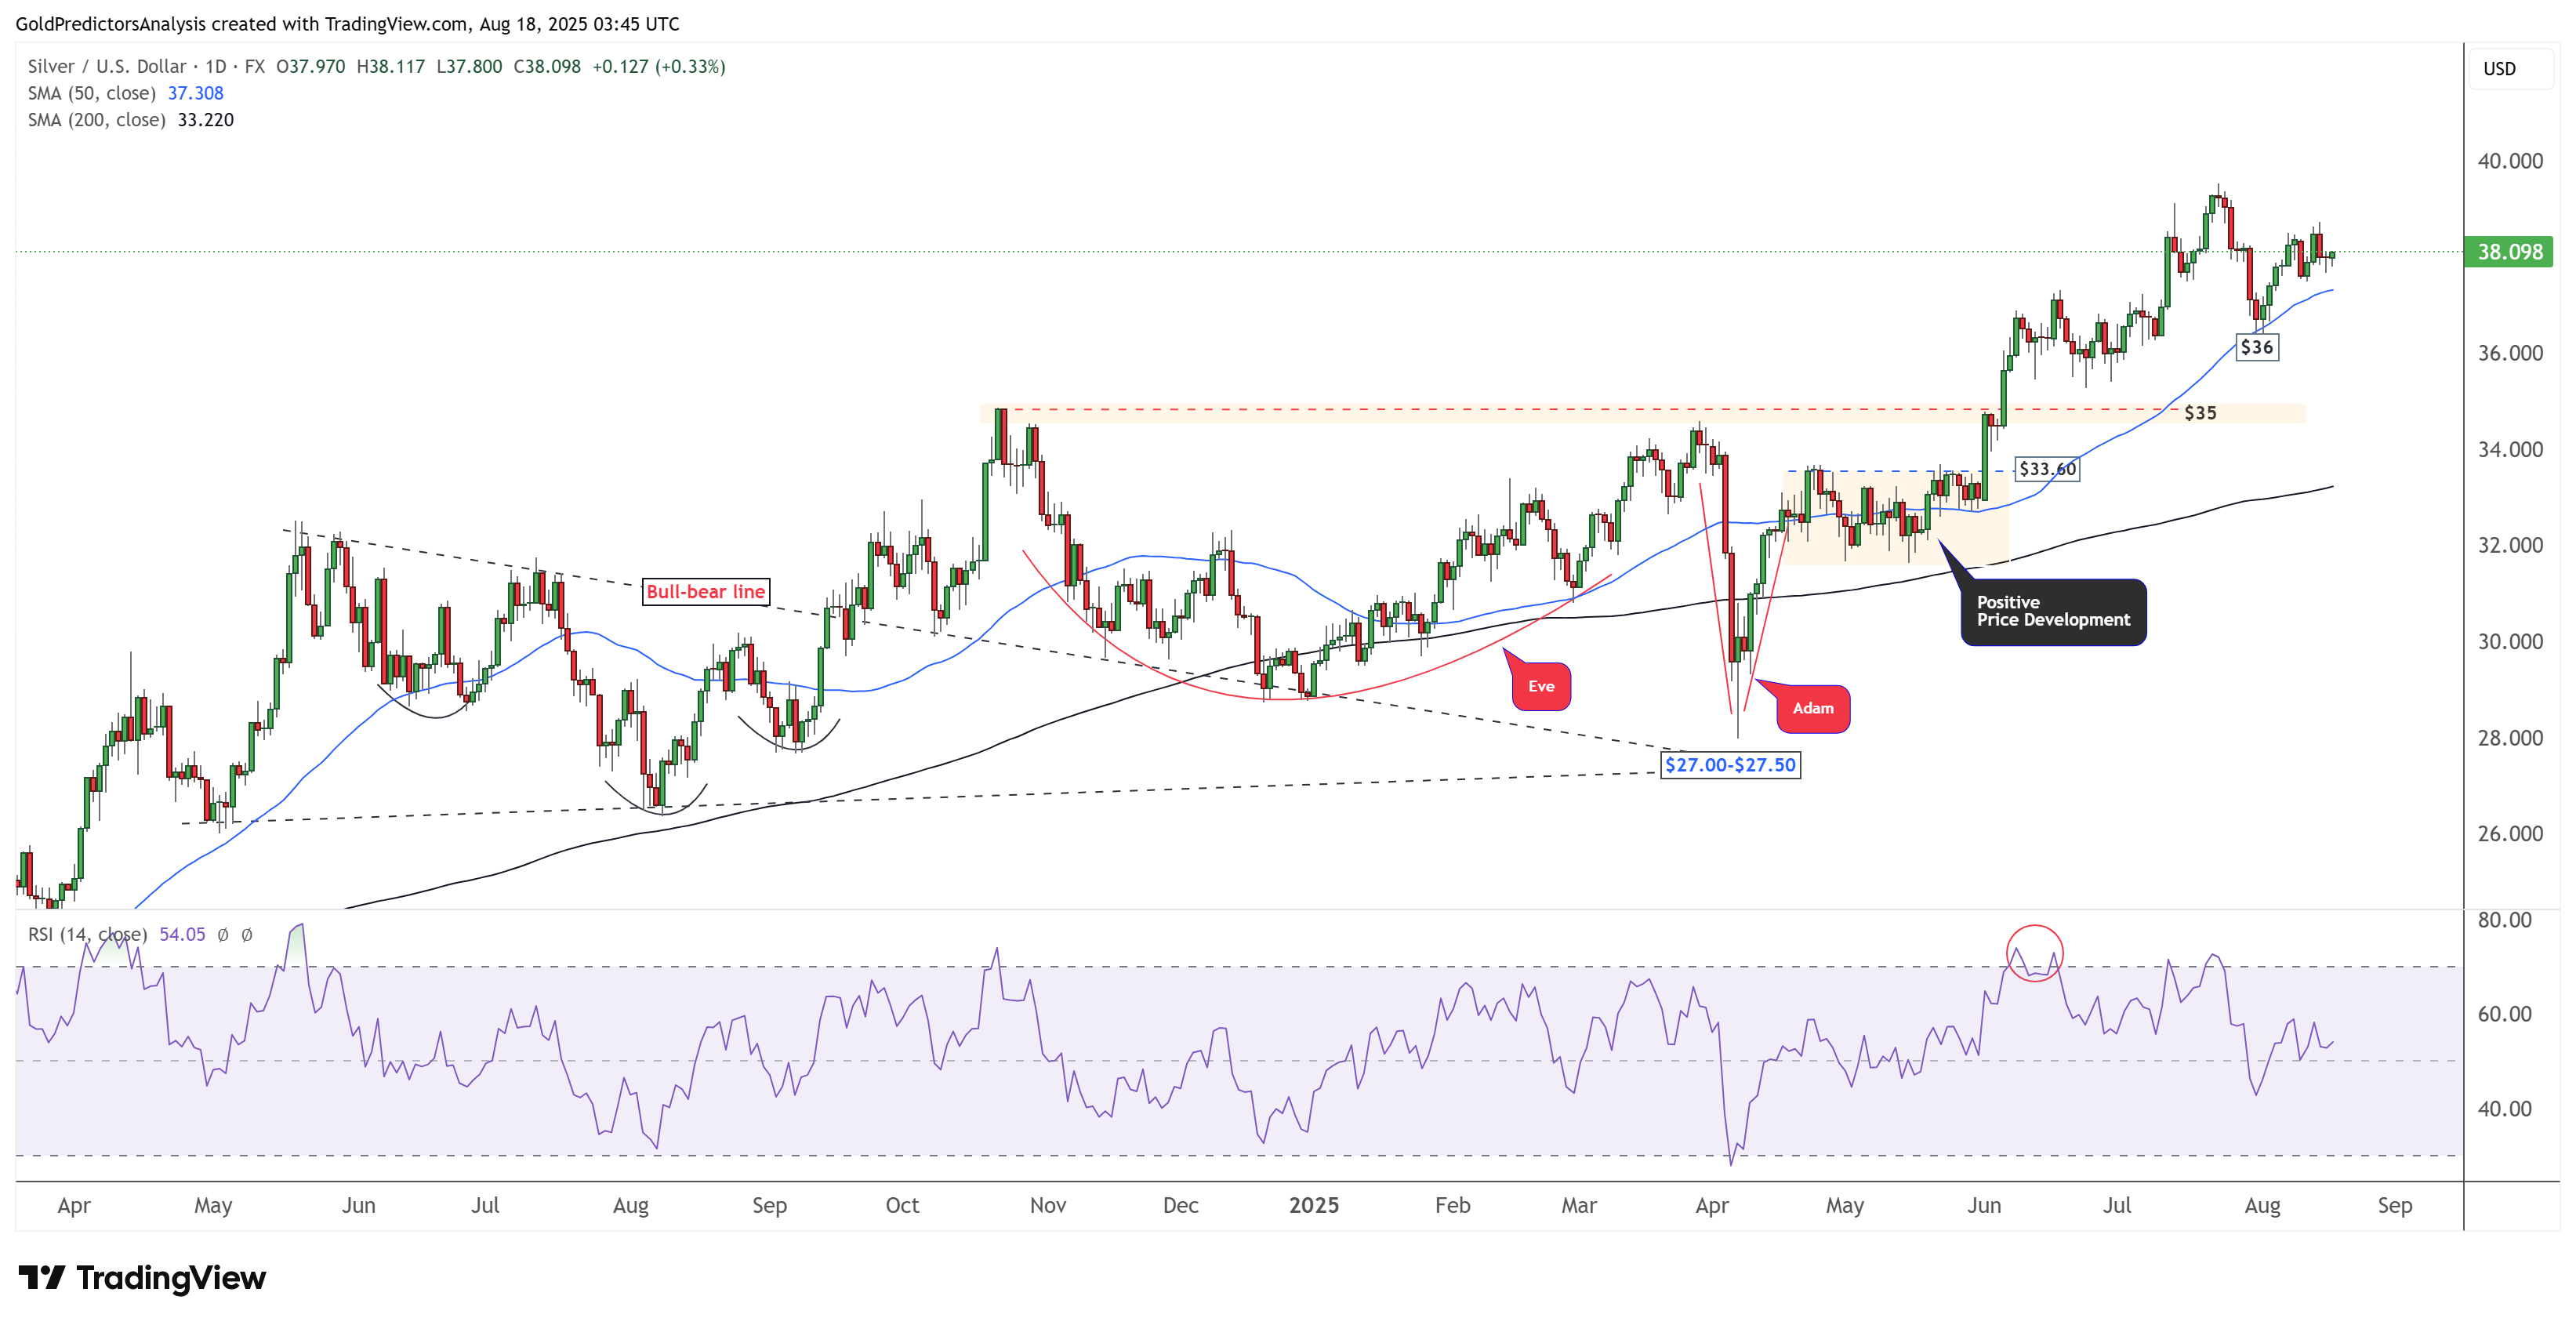
The daily chart for spot silver (XAGUSD) shows that the price has formed a bullish pattern and broken above the $35 level. The breakout, along with strong support above the 50-day SMA around $36, suggests that prices may continue to trade higher in the coming weeks.
A move above $38 would likely push silver toward the $43 area. Moreover, the RSI is consolidating above the mid-level, which signals a bullish price structure.
XAGUSD 4-Hour Chart – Bullish Price Action
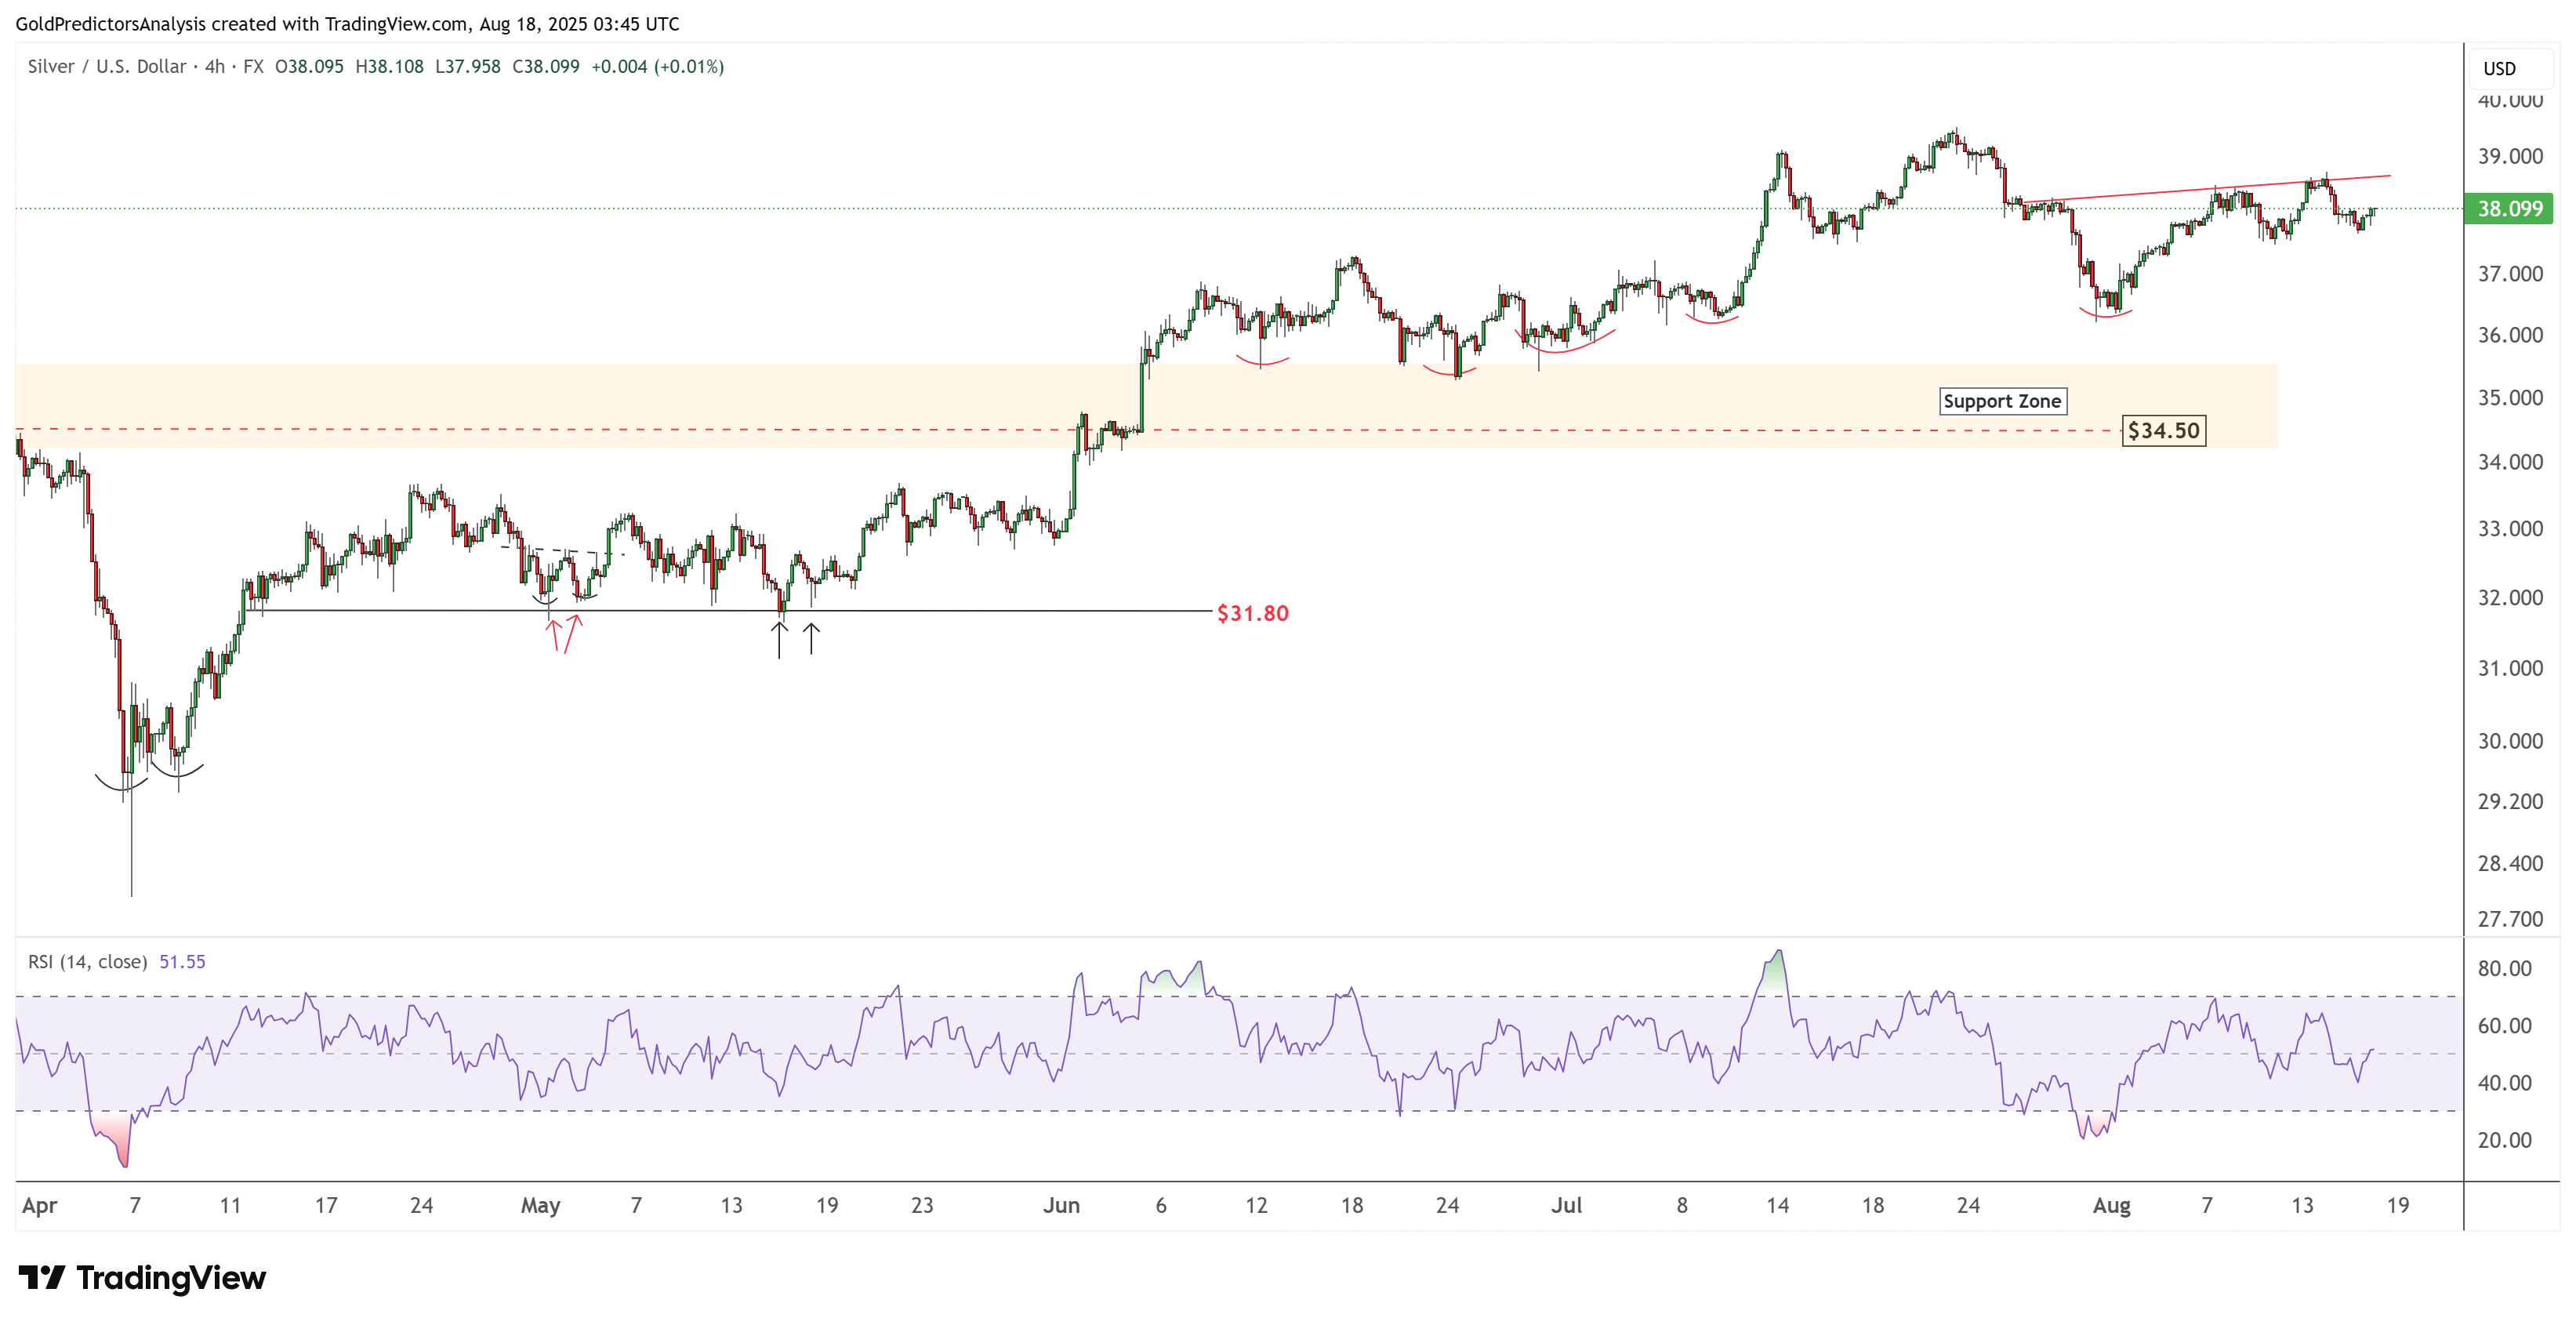
The 4-hour chart for spot silver shows that the price is consolidating below the $39 area, maintaining a bullish price structure. A break above $40 would take silver prices to new highs.
Meanwhile, the emergence of bullish momentum above the $31.80 and $34.50 support areas suggests that silver is likely to continue trading higher.
US Dollar Index Technical Analysis
US Dollar Daily – Negative Price Action
The daily chart for the US Dollar Index shows consolidation around the 50-day SMA, with a bias to trend lower. A break above 100.50 would open the way toward the 102 level. However, a drop below 96 would be bearish and could trigger a sharp decline toward the 90 area.
FXEmpire


