U.S. ETFs drive gold demand and trading volumes in Q3, price forecasts revised higher – World Gold Council
NEW YORK (November 6) U.S. gold demand rose 58% compared to Q3 2024, while North American ETF inflows reached $16bn and trading volumes surged, according to the Q3 Gold Demand Trends report from the World Gold Council (WGC).
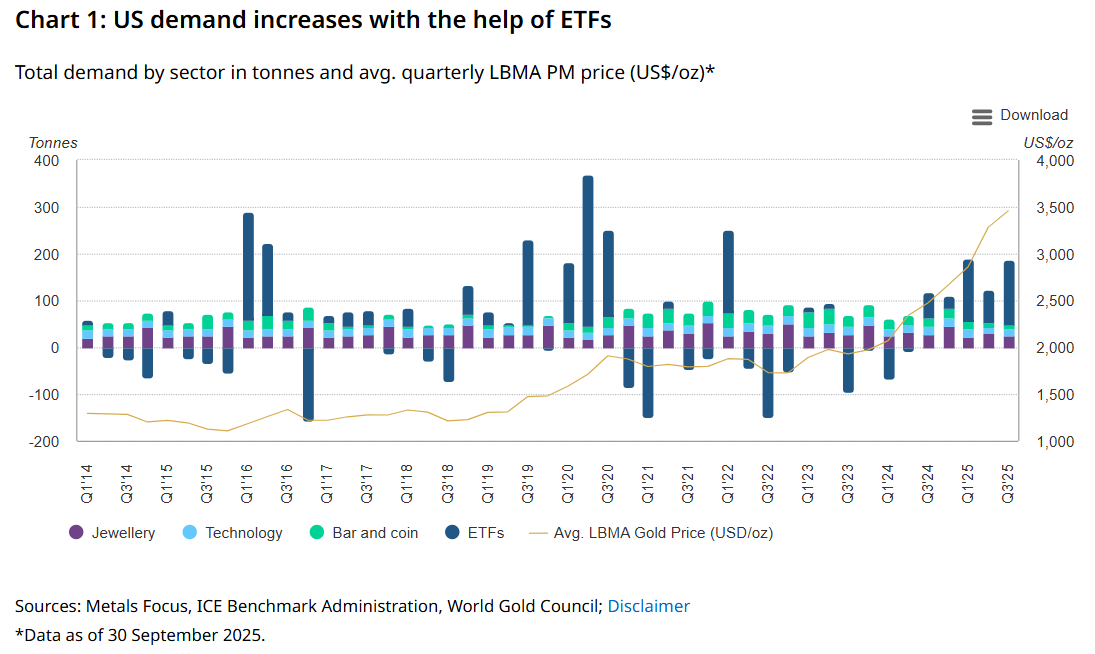
“Overall gold demand in the US rebounded in the third quarter, in which demand of 186t grew 58% y/y,” WGC analysts wrote. “Consumer demand (jewellery + bar and coin) of 32t fell 33% y/y. Gold jewellery consumption continued the downward trend that started back in Q2’22, falling 12% y/y to 25t. Jewellery spend, in value terms, fell 12% q/q to US$2.7bn, but grew 23% y/y to mark its ninth consecutive y/y increase.”
U.S. bar and coin demand declined sharply once again, falling 64% year-over-year to 7 tonnes in the quarter. “This marked the weakest demand since the pre-COVID 2017–19 trough, which caused the Americas to be the only major region to post a y/y decline in Q3,” they said. “Demand by value did not fare much better and fell 49% y/y to US$801mn. However, the figures obscure the true picture: a weak quarter was the result of strong two-way activity as robust buying was met with profit taking.”
Demand from the tech sector was mixed across the four major electronics fabrication hubs. “[T]he US (-16t, -2% y/y) and Japan (-19t, -4% y/y) declined; while South Korea (+7t, +1% y/y) and Mainland China & Hong Kong (+21t, flat y/y) held steady,” the analysts noted.
Meanwhile, ETFs drove overall demand once again, with U.S.-listed ETFs adding 137 tonnes of gold in Q3 – a 160% year-over-year increase – bringing total holdings to 1,922 tonnes for $236 billion in AUM.
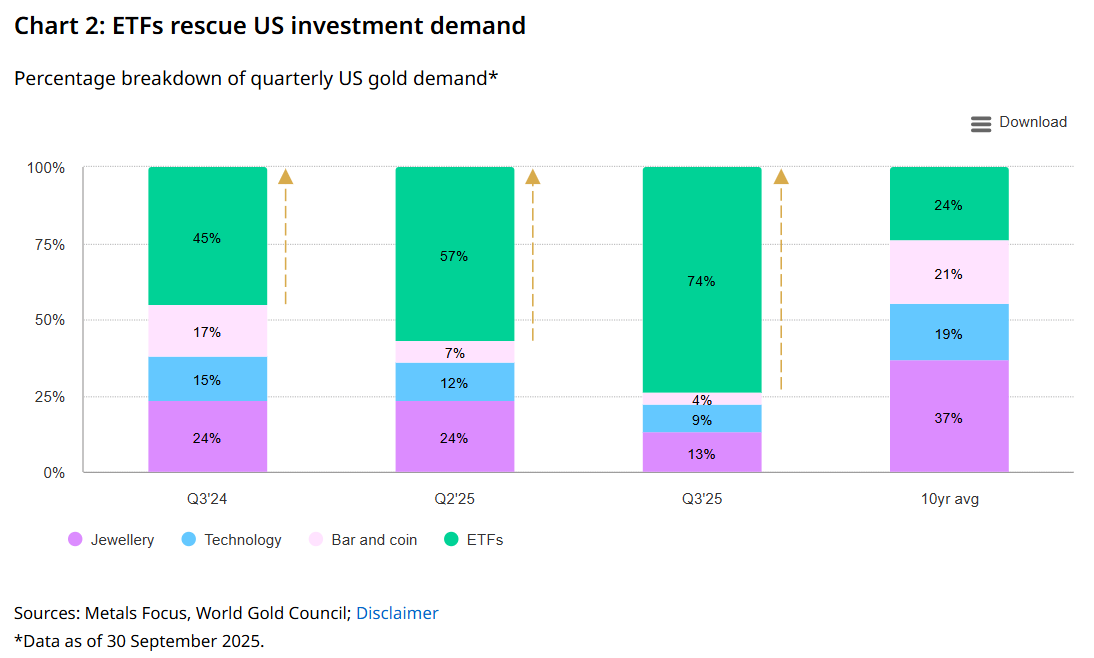
The WGC said gold-backed ETFs served as quarterly lifeline amid declines in other key sectors.
“Q3 marked a record quarter for gold-backed ETFs, with global inflows of US$26bn and total holdings rising by 222t to 3,838t,” the analysts wrote. “Particularly striking was the US contribution, which accounted for 137t (US$16bn), or 62% of global demand. This surge significantly altered the US gold demand picture. Had the Q3 figure been replaced with the 10-year average of 21t – or even last quarter’s 70t – total demand in the quarter would have fallen by 44% q/q or 4% q/q, respectively, rather than showing a 50% q/q increase.”
“Year-to-date cumulative net inflows for North American gold-backed ETFs reached US$37bn through September – 99% of which came from US-based funds – putting them on pace for their strongest annual performance on record, with preliminary October data confirming this milestone,” they added.
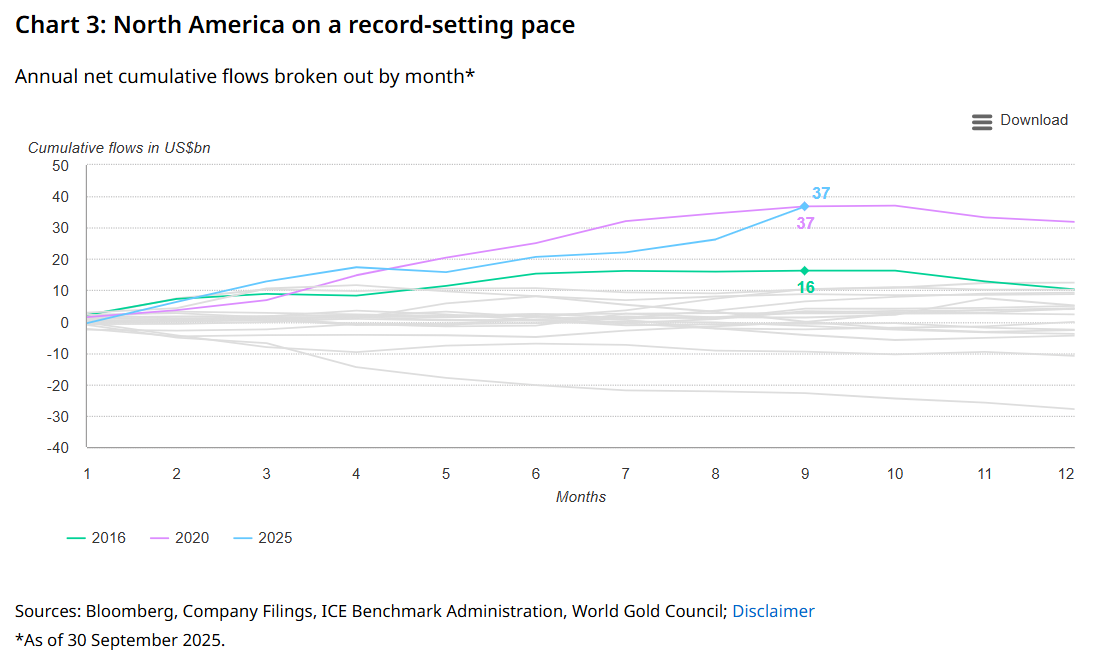
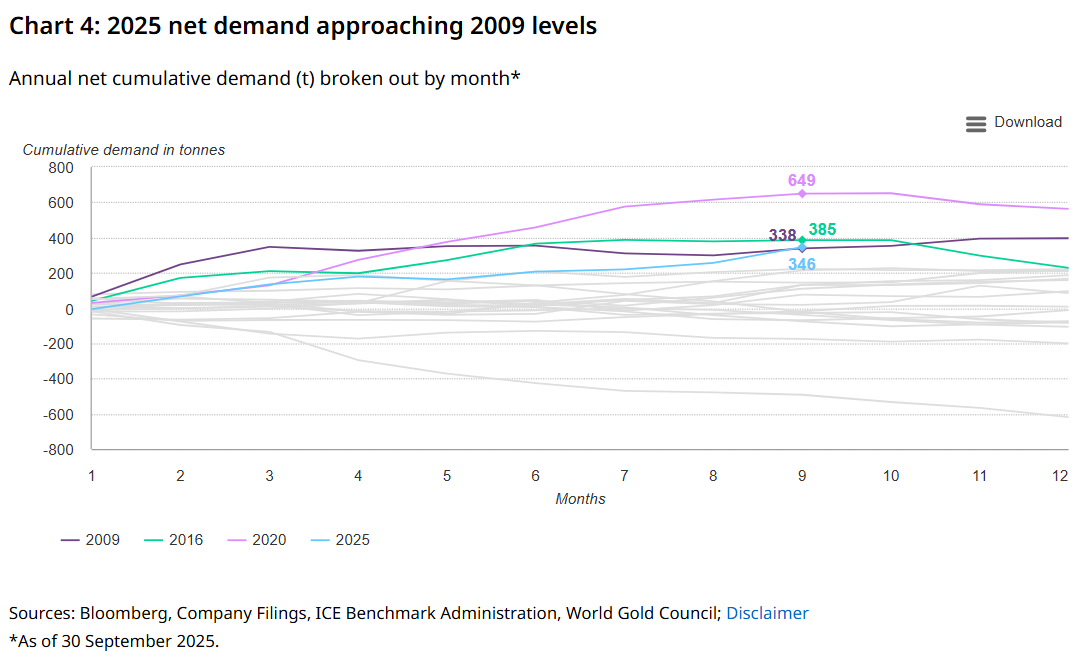
Demand was also very robust in tonnage terms, with North American funds now on pace to deliver their third-strongest year on record.
WGC analysts also drilled down into U.S. trading volumes compared to other key regions.
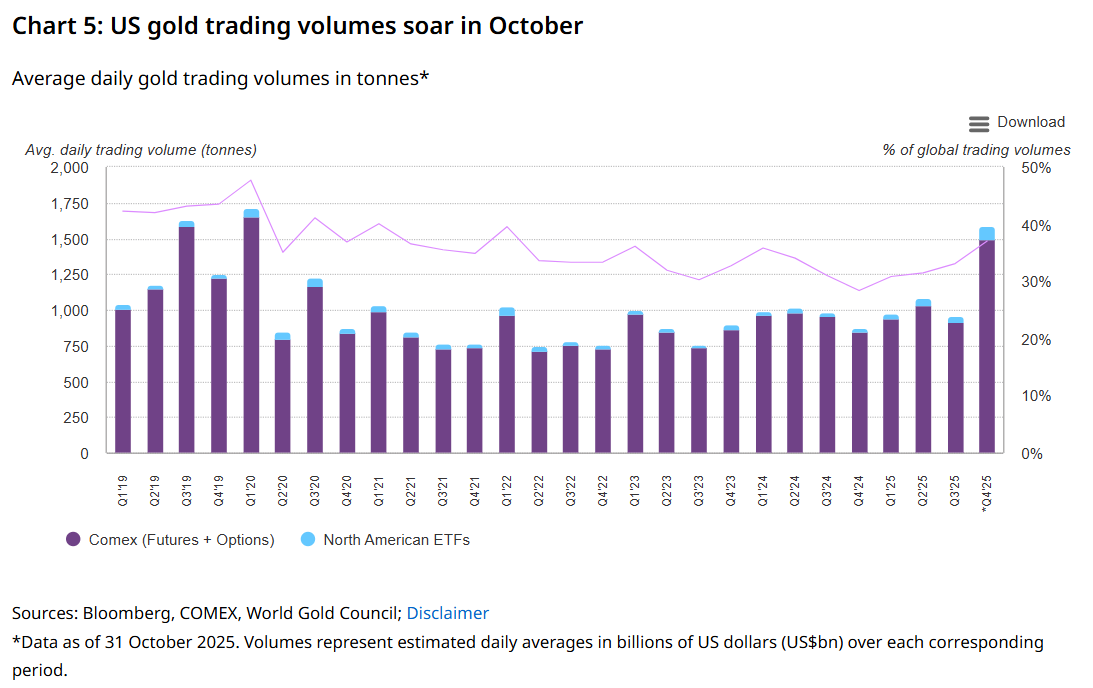
“In Q3 average daily trading volumes of COMEX futures and options reached US$104bn (915t), up 35% y/y, while North American ETFs (dominated by US funds) averaged US$5bn (42t) per day, up 109% y/y,” they noted. “Together they accounted for 33% of global market liquidity. Although US volumes eased q/q, this was mainly due to subdued activity in July and August as gold prices moved sideways. Momentum returned in September, when gold began to rally and recorded 13 new all-time highs, driving US trading volumes to a record US$138bn (1,152t) per day, a 59% m/m increase.”
The analysts said this strong momentum carried over into October, with 11 new price peaks pushing gold to its 50th all-time high of the year. “The rally was quickly followed by a pullback in the price into month-end (-8%), which spurred volatility and helped lift US trading volumes 51% m/m to a new record of US$208bn (1,587t) per day,” they said.
The WGC also included some commentary from North America retail industry players on current market trends.
Analysts were told that retail gold demand has improved since the end of Q3. “As retail investors have shifted from net sellers to net buyers, secondary market liquidity has dried up, prompting dealers to turn to refineries for products,” they said. “However, refineries are hesitant to invest in capacity expansion, citing low returns on gold bar production despite high prices, as well as higher costs.”
Costco’s gold business is also booming online and in-store, driven by consumer trust in the brand as well as static pricing of gold products in a rising price environment. “Costco is also adding new product sizes in an aim to further increase sales,” they noted.
And U.S. fractional gold bar demand is also very strong. “Dealers are consequently willing to pay higher premiums for smaller formats, although production capacity limits fulfilment,” the analysts wrote.
The World Gold Council also shared updated gold price forecasts from industry experts.
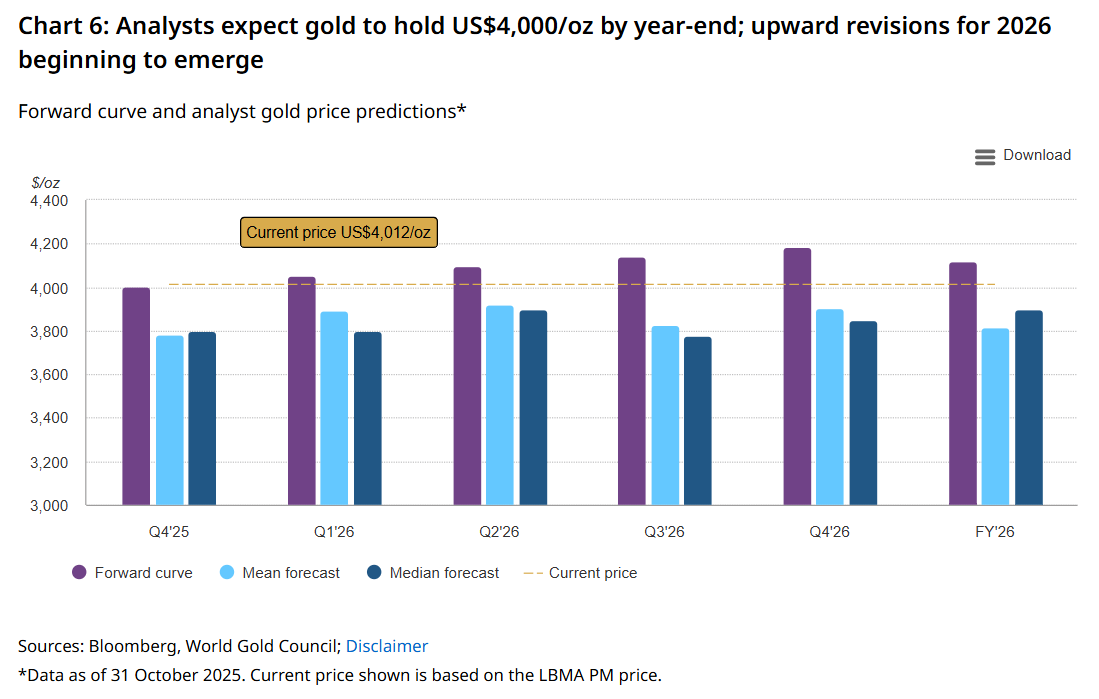
“Following gold’s recent rally, both the forward curve and analyst forecasts have shifted higher,” they said. “Bloomberg consensus forecasts currently point to prices rising through the first half of 2026 before easing toward year-end.”
And as analysts digest the recent moves in the gold price, new estimates have begun to trickle in. “Revisions in October show an average Q4’25 forecast of US$4,000/oz, while full-year 2026 targets have edged higher, ranging from US$4,500 to US$5,000/oz,” they noted.
KitcoNews


