Gold (XAUUSD) & Silver Price Forecast: Khamenei Issues War Warning – Safe Haven Surge or Bull Trap?
LONDON (March 13) During the Asian trading session, the Gold (XAU/USD) maintained its upward trend and remained well bid around above the $5,120 level. However, the bullish rally was mainly supported by escalating geopolitical tensions in the Middle East and safe-haven demand.
On the other hand, the stronger US dollar, backed by the reduced bets of interest rate cuts by the US Federal Reserve (Fed), was seen as a key factor that are capping gains in the Gold price.
Geopolitical Tensions Drive Safe-Haven Demand
As we mentioned, the Gold gained traction after Iran’s new supreme leader, Mojtaba Khamenei, gave his first public warning, saying all US military bases in the region should close immediately or they would be attacked. He also said that attacks on US bases would continue, even though Iran wants to be friendly with its neighbors.
Meanwhile, US President Donald Trump said stopping Iran’s “evil empire” is more important than keeping Oil prices stable. This, along with the US-Israel conflict in Iran, has pushed Crude Oil prices higher.
People are worried that the closure of the Strait of Hormuz could stop oil supplies, which may cause inflation to rise. Because of this, investors are now expecting fewer interest rate cuts from the US Federal Reserve (Fed) in 2026.
Traders Eye US Inflation Data as Key Factor for Gold and Dollar Movement
Looking forward, traders are watching the upcoming US Personal Consumption Expenditures (PCE) Price Index. If inflation is high, people expect the Fed to keep interest rates higher, which could make the US Dollar stronger and limit Gold’s gains.
But if prices grow more slowly, investors may turn to Gold again as a safe investment.
Gold Price Forecast: Can XAU/USD Hold $5,040 as Risk Premium Fades?
Gold – Chart
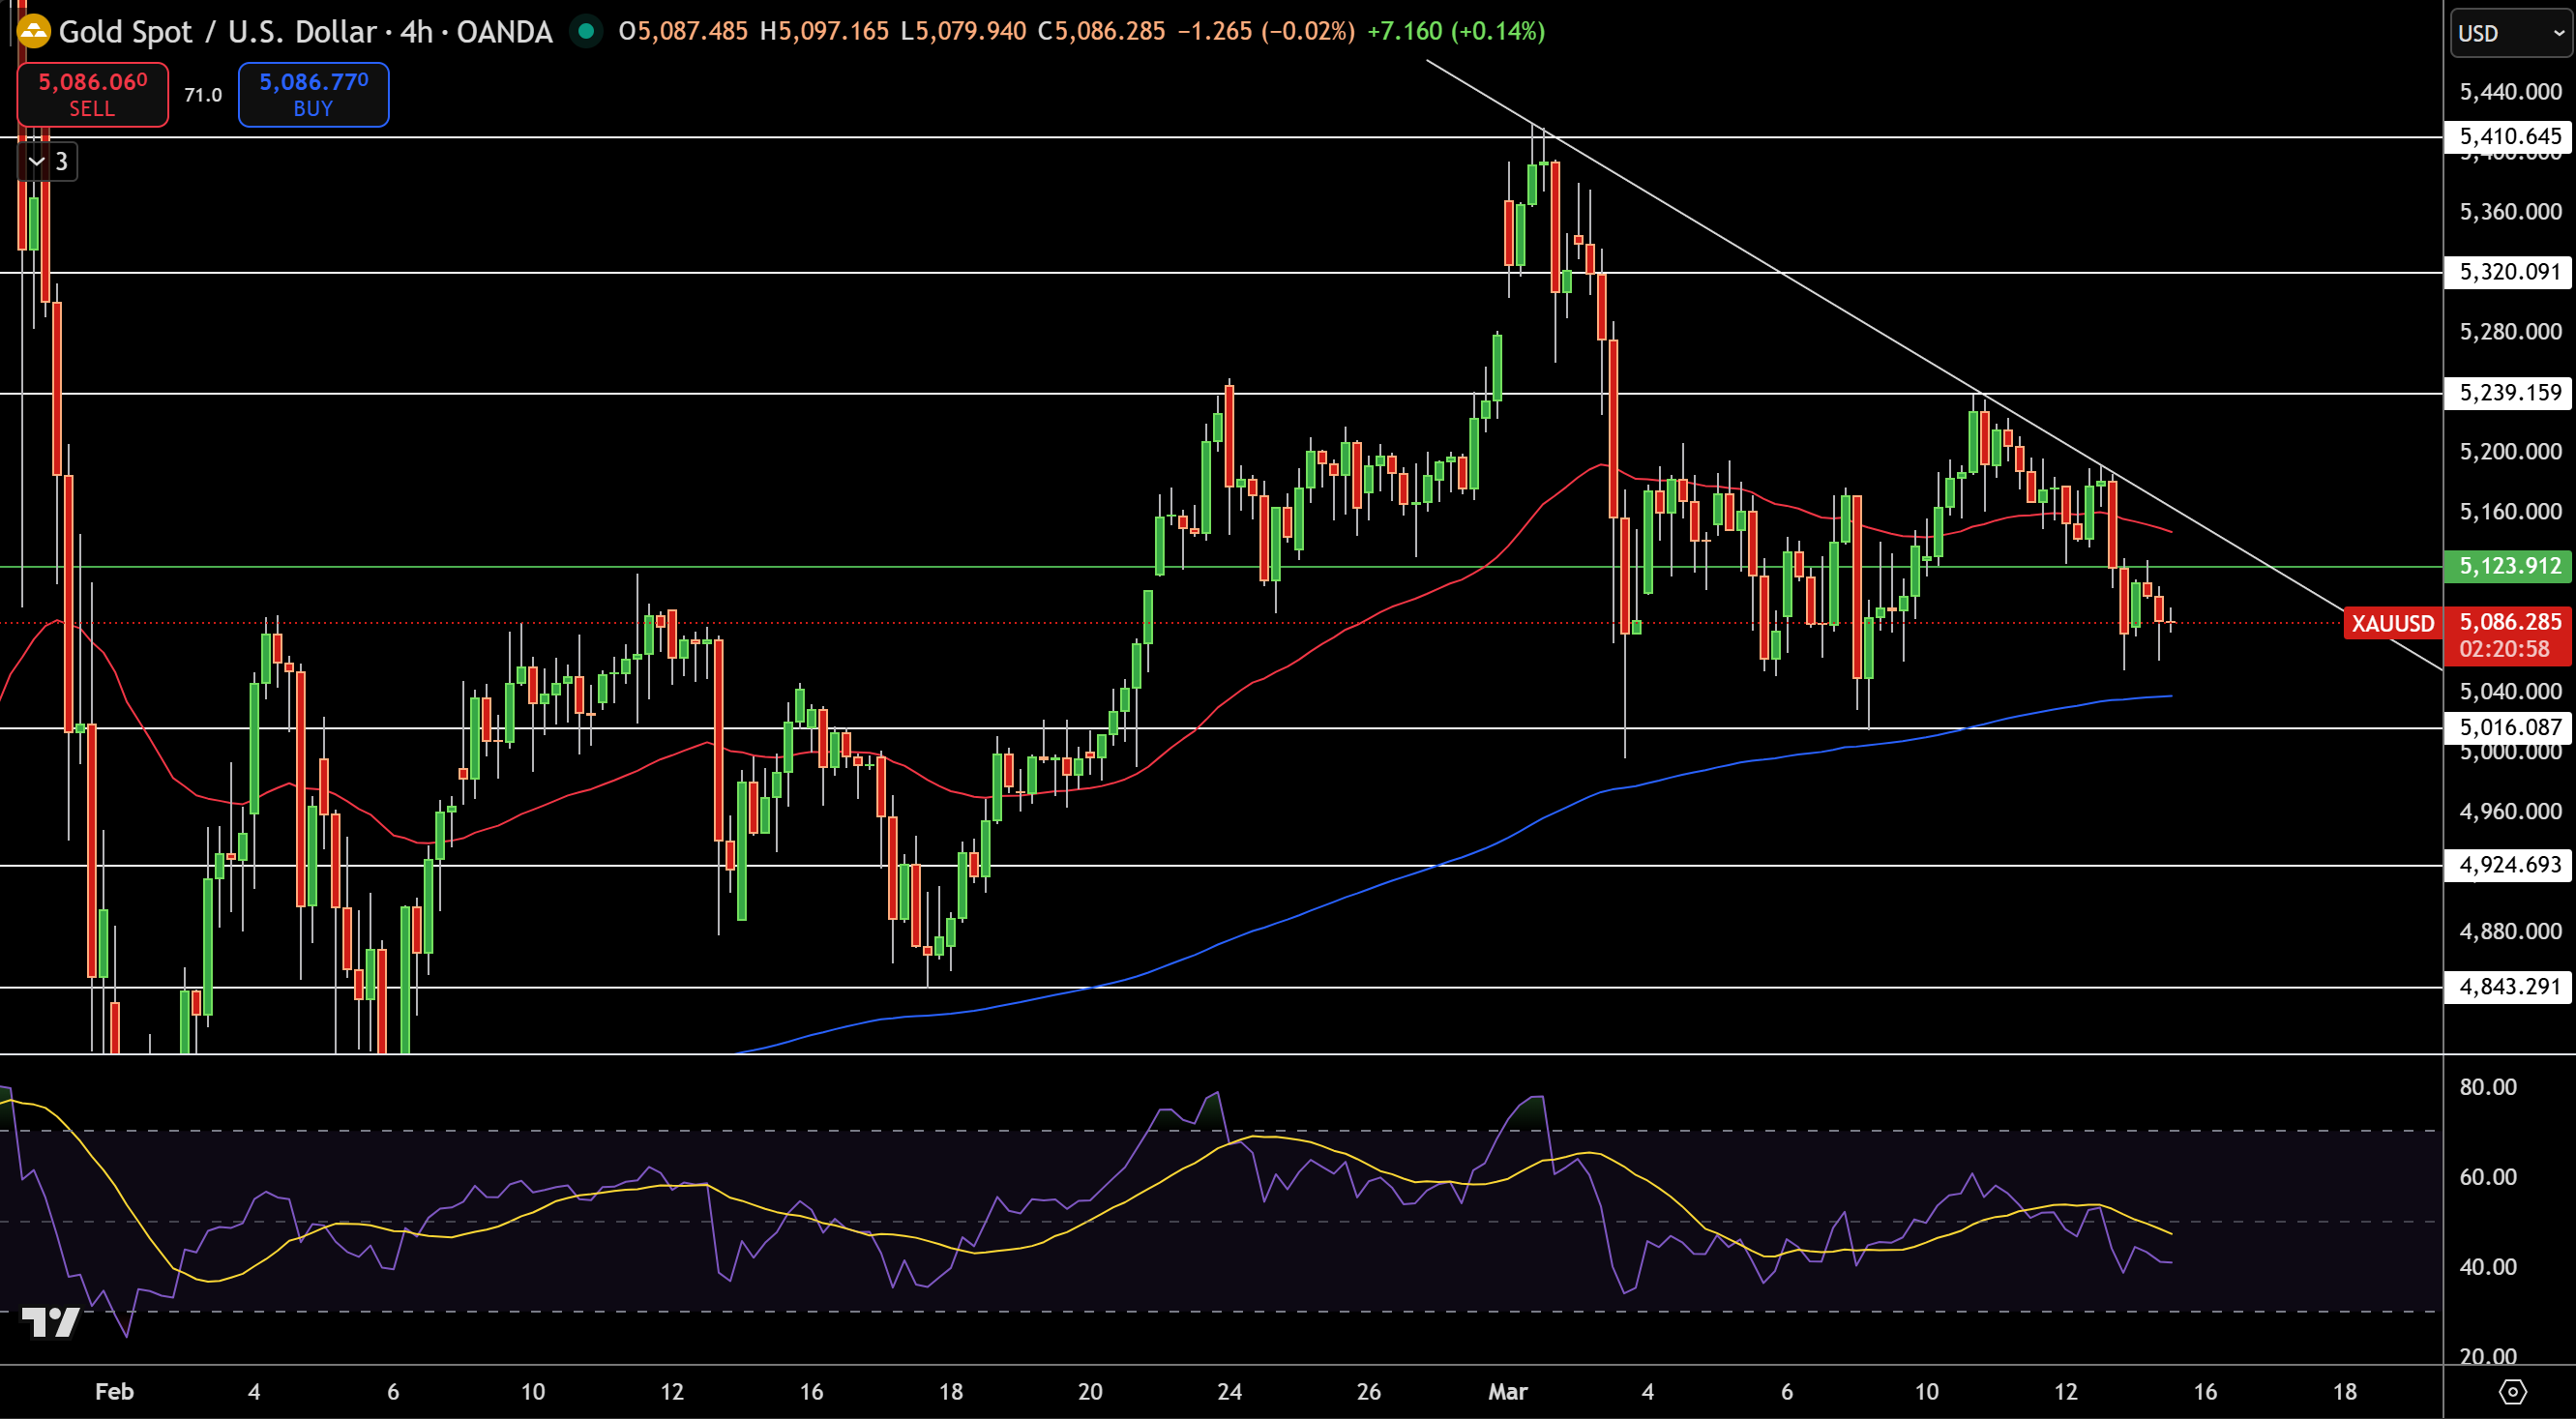
Gold is really close to $5,086 on the 4-hour chart right now, just taking it easy after that wild swing up that happened because of all the geopolitical supply risks coming to a head – prices are higher and on top of that key support level at $5,040, and the 200-period moving average is angling upwards so the overall bull trend is still looking pretty good – but there is this trendline down around $5,200 that just keeps gumming up the works up above.
RSI is sort of stuck in neutral land around 45-50, suggesting that the momentum is really starting to die down. If we do break above $5,200, the next stop is probably $5,320; if we break below $5,040, watch out for $4,925.
Silver Price Forecast: Will $84.40 Break as Volatility Cools?
Silver – Chart
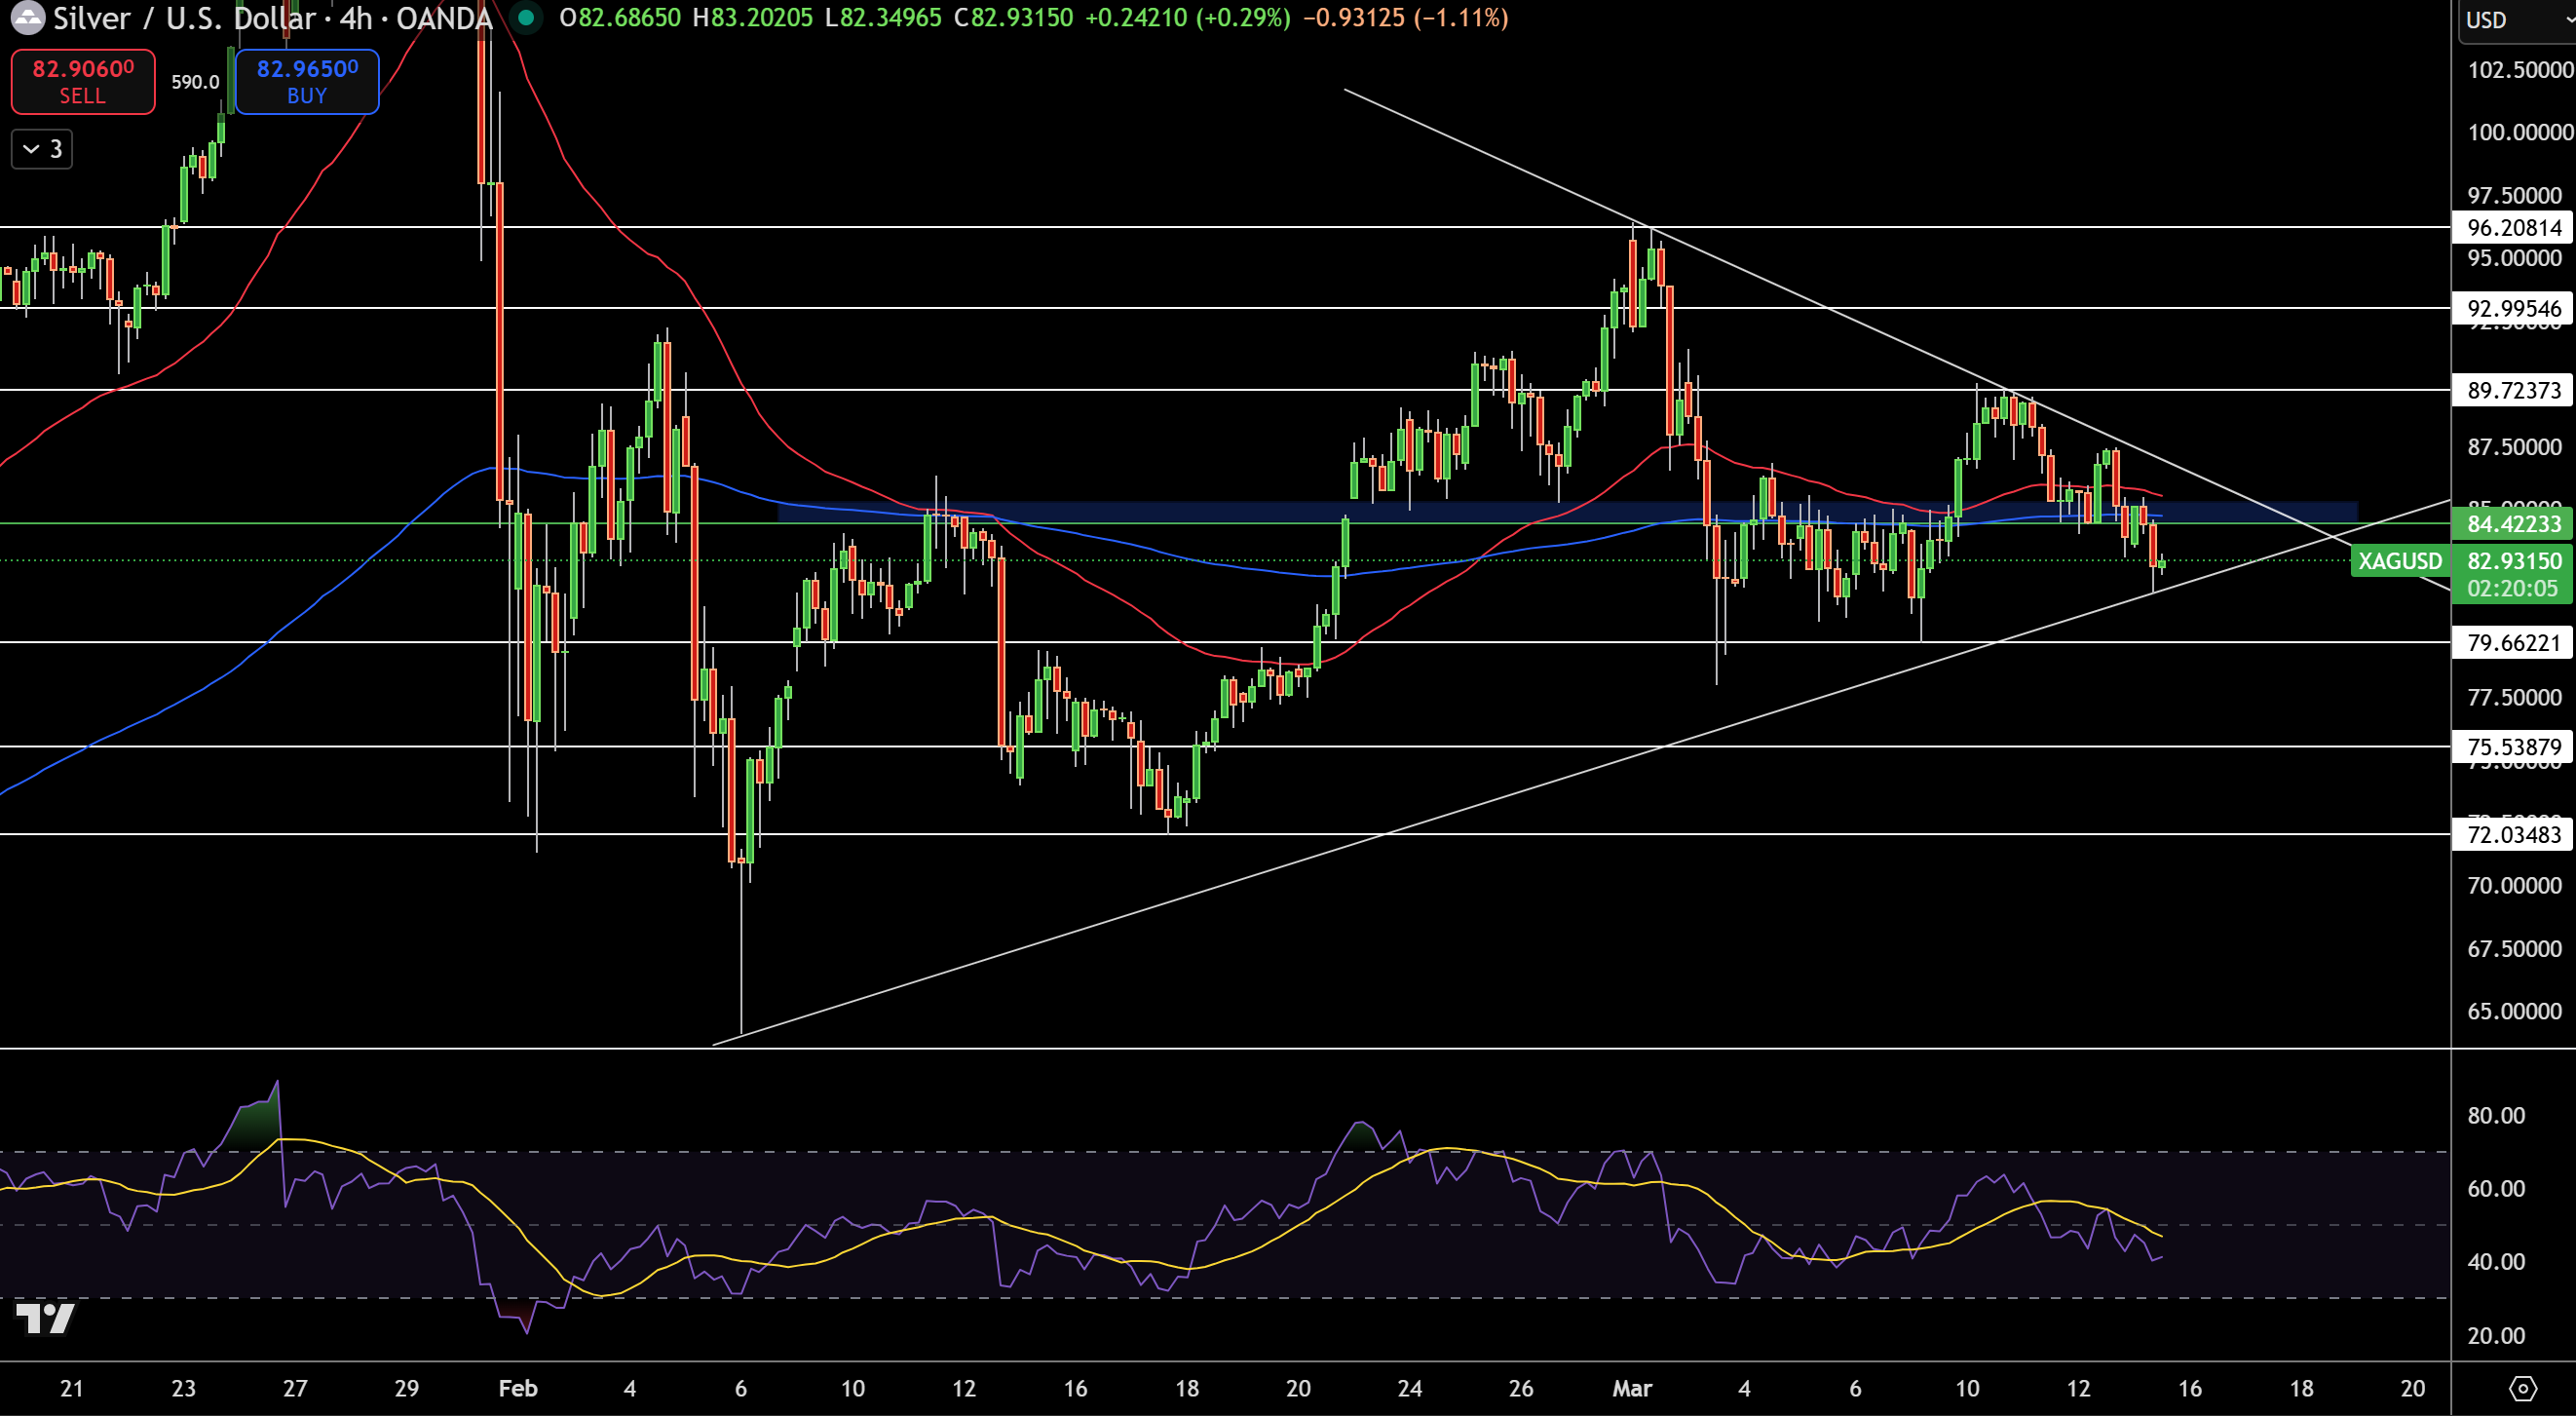
Silver is trading right around $82.93 at the moment, and it’s pretty clear it’s getting all cramped up in this triangle pattern on the 4-hour chart, with $84.40 as the first point of resistance and $79.66, along with that long-term trendline, as the real bottom. Now, the 50-period moving average is looking pretty flat, suggesting some short-term indecision, but the 200-period MA is still up, which is a good sign for the overall trend.
RSI is still looking pretty modest, around 45, which says that the momentum is still there but it’s weakening – and like we said before, the energy prices being high has been keeping a lot of people buying silver as an inflation hedge, but if the volatility keeps dying down then we might just see some real consolidation here – and if we do break above $84.40 then we might see $87-$89, but if we break below $79.60 then things could get ugly.
FXEmpire


