IEA: Largest Oil Disruption in History. What It Means for Silver


Oil above $100. The economy just lost 92,000 jobs. India opens institutional silver buying in 19 days. And the mining industry can't respond.
On March 12, Brent crude closed above $100 per barrel for the first time since August 2022 — after Iran's new Supreme Leader, Mojtaba Khamenei, declared that the Strait of Hormuz must remain closed. The International Energy Agency responded by announcing the largest emergency reserve release in its history: 400 million barrels, with the United States contributing 172 million from the Strategic Petroleum Reserve. The oil market shrugged it off. Brent barely moved. Traders understood what the IEA itself acknowledged in its March report: the war has created "the largest supply disruption in the history of the global oil market," with Gulf countries cutting at least 10 million barrels per day of production.
Meanwhile, silver is trading around $84 — essentially where it was a week ago when I published Issue #9 of the Silver Catalyst newsletter. The consolidation has now extended into its second week. Gold sits near $5,100. The gold-silver ratio holds at 60-62:1.
In Issue #7, I documented how the January-February crash revealed the widest paper-physical divergence in decades. In the first free article from Issue #9, I covered the Iran war's oil-silver transmission mechanism, the COMEX delivery crisis (59% of registered inventory demanded in one month), and AI's $700 billion silver appetite. This article covers a different set of forces — ones that are less dramatic than war but potentially more consequential for silver's structural trajectory.
There are nine Deep Dives in this week's premium Silver Catalyst issue, and in this free article, I'll discuss three of them.
India's SEBI Opens the Floodgates: A $970 Billion Allocation Channel
On February 26, India's Securities and Exchange Board (SEBI) announced reforms permitting mutual funds to allocate up to 35% of assets to non-core holdings, including gold and silver ETFs. A separate SEBI circular on valuation methodology takes effect on April 1 — now 19 days away — mandating that Indian ETFs use domestic exchange-published spot prices rather than LBMA international benchmarks. The practical consequence: Indian mutual fund NAVs will reflect local demand conditions, where silver typically trades at a premium to London.
India's mutual fund industry manages approximately ₹81 trillion (roughly $970 billion). Even modest allocation creates enormous demand:
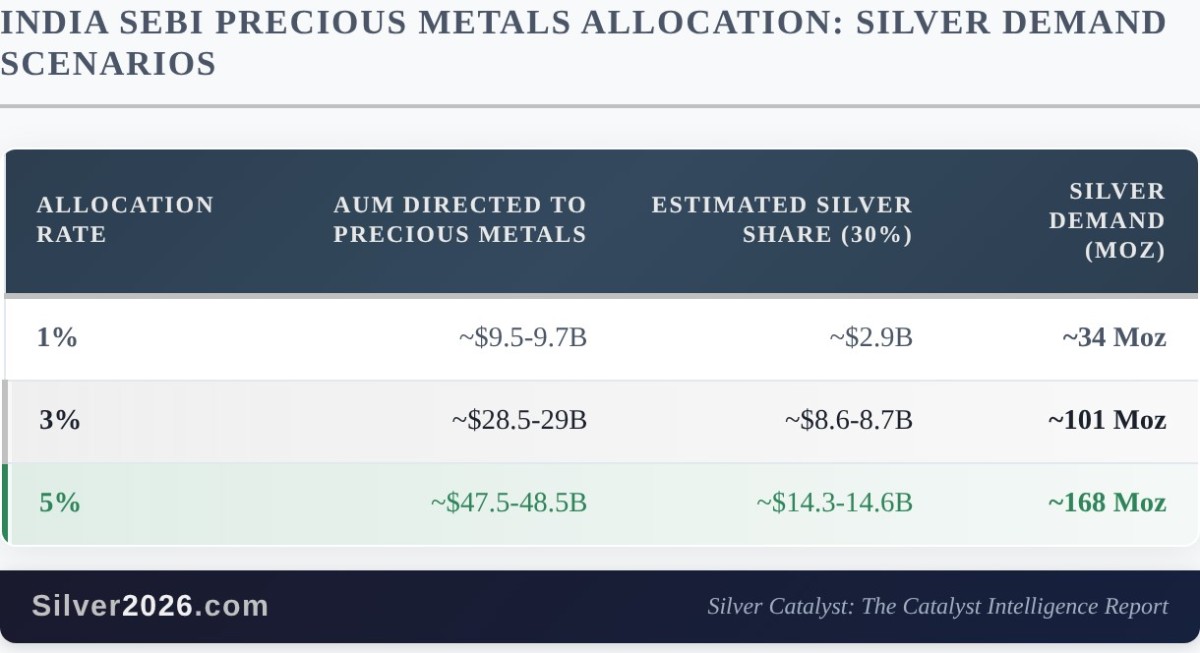
At 1% adoption, 34 Moz of new demand — roughly half the projected 2026 structural deficit. At 3%, the new demand exceeds the entire annual deficit. At 5%, it represents roughly 20% of total global mine supply.
This isn't speculative demand from retail traders. It's institutional capital with multi-year investment horizons, allocated by fund managers operating within a regulated framework. Once funds establish precious metals positions, they tend to maintain them through market cycles.
India's silver appetite was already extraordinary before the SEBI reform. The country imported roughly 180-190 Moz in 2025 — approximately one-quarter of global mine supply. Silver ETF inflows nearly tripled year-over-year to ₹234.7 billion. The SEBI rule change adds an institutional channel on top of what was already the world's strongest physical silver market.
The April 1 effective date means this isn't a distant possibility. It's a near-term catalyst with a specific activation date — 19 days from today.
Stagflation, $100 Oil, and the Fed's Impossible Position
The February jobs report released on March 6 showed the US economy lost 92,000 jobs — dramatically worse than the consensus estimate of +50,000 gain. The unemployment rate rose to 4.4%. It was the third time in five months that the economy lost jobs. The three-month average now stands at fewer than 6,000 payrolls per month.
Separately, Q4 2025 GDP came in at just 1.4%. Core PCE inflation remains at 3.0%. PPI rose 0.5% month-over-month.
Now layer oil above $100 on top of this.

This is the textbook definition of stagflation: economic growth stalling while inflation persists and accelerates. The 1970s demonstrated what happens to precious metals in this environment — silver rose over 40% during the 1973-75 recession and from $6 to $50 during the broader stagflation decade.
The Fed is paralyzed. Any rate increase to combat oil-driven inflation would risk collapsing an economy already losing jobs. Any rate cut would pour fuel on energy-driven inflation. The Warsh nomination for Fed Chair remains unresolved, Powell's term expires in May, and FOMC minutes from February 18 revealed discussions of rate increases — the first such discussion in over two years.
Gold has responded by holding above $5,000, with central banks buying an estimated 50-60 tonnes per month and China making 15+ consecutive monthly purchases. Silver benefits through ratio compression — the gold-silver ratio has compressed from 100:1 to 60-62:1 over the past twelve months.
The Iran war didn't create the stagflation setup. The macro data was already deteriorating before the first strike on February 28. What the war did was inject a $100+ oil shock into an economy that was already faltering — the classic mechanism through which stagflation transitions from risk to reality.
The Broken Supply Response: Why $84 Silver Can't Fix a Geological Problem
Silver's price has more than doubled from its 2024 levels. In a functioning market, that kind of price signal should trigger a supply response — new mines, expanded production, reactivated projects. It hasn't happened. And the data from the past two months explains why it can't.
Fresnillo plc, the world's largest primary silver producer, cut 2026 guidance to 42-46.5 Moz — down 9%. Hecla and First Majestic are guiding lower. Mexico, which represents 25% of global silver supply, continues its moratorium on new mining concessions.
S&P Global's mine cost outlook projected global weighted-average silver AISC would rise 3.8% to $23.44/oz in 2026 — and that was before oil crossed $100. With Brent now above $100, energy costs have surged for every mining operation globally. Every dollar increase in diesel raises extraction costs across the 70-80% of silver production that comes as a byproduct of base metal mining.
The structural constraints are binding:

The BHP-Wheaton $4.3 billion streaming deal, announced February 16, is particularly telling. When the world's largest diversified miner locks up silver production at 20% of spot through the largest streaming transaction in history, it signals institutional conviction that physical silver is worth a historic premium to secure. It also removes that production from the open market.
Mine development takes 15.7 years. Even if a mining company decided today to develop a new primary silver deposit in response to $84 prices, the first ounce wouldn't reach market until 2042. The supply cavalry isn't coming.
What This Means
Three structural forces are tightening the noose around silver's supply-demand balance — and none of them can be resolved by short-term price movements.
India's SEBI reform opens an institutional channel into a nearly $1 trillion asset base in 19 days. The mining industry cannot respond to price signals because of geological constraints, declining ore grades, and a 15.7-year development timeline. And the macroeconomic backdrop has shifted from "risk of stagflation" to "stagflation is here" — with oil above $100, the economy losing jobs, and the Fed unable to act in either direction.
These aren't speculative forces. India's SEBI reform has a specific date. The ore grade data is geological fact. The February jobs report is published by the Bureau of Labor Statistics. The supply deficit is in its sixth consecutive year. And the mining constraints don't ease because silver went from $30 to $84 — they get worse, because the easy ore was extracted decades ago.
Silver's current price of ~$84 reflects a market that has absorbed the February correction and is consolidating. It does not yet reflect the activation of a $970 billion institutional allocation channel, the impact of $100+ oil on mining costs, or the full stagflation transmission from energy prices to precious metals demand. Those forces are incoming. The timeline is measured in days and weeks, not months and years.
The structural supply-demand imbalance I just described is one dimension of the 100-catalyst framework I analyze in "Silver Rising." The full Issue #9 contains six more Deep Dives covering the COMEX delivery crisis and the 59% inventory-to-demand ratio, the Iran war's direct oil-silver transmission channels, China's export controls creating a two-front supply squeeze, AI's $700 billion annual silver demand, market structure stress including the CME trading halt and Eric Sprott's $300 projection, and solid-state battery progress with the EU Digital Product Passport. If you want to understand where this market is headed and stay informed as it unfolds, I encourage you to get "Silver Rising" with complimentary 2-week access to the Silver Catalyst newsletter.
********
 Przemyslaw Radomski, CFA, is the founder, owner and the main editor of SunshineProfits.com.
More from Silver Phoenix 500


