Why Solar Panels, EVs, and AI Are Driving Silver Demand to Record Highs
How technology's evolution created structural demand for an ancient metal


Your smartphone contains silver. So does your laptop, your car, your refrigerator, and the solar panels on your neighbor's roof. The LED lights in your home, the touchscreen on your tablet, the 5G tower transmitting this article to your device—all require silver to function.
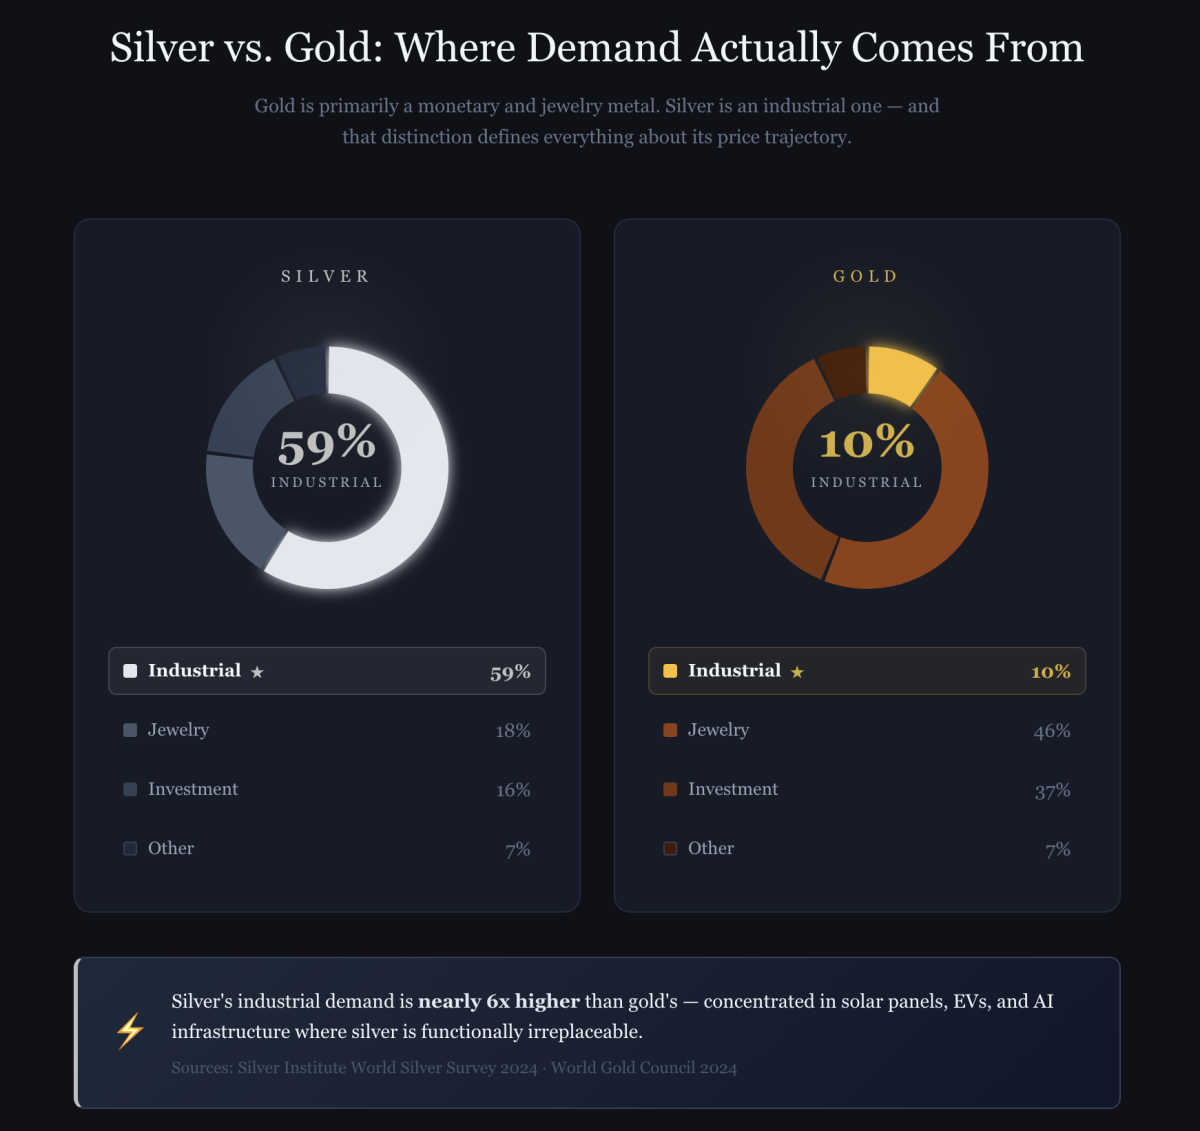
Here's what most investors don't realize: gold—the metal silver is almost always compared to—has virtually no industrial utility. Only about 10% of gold demand is industrial, and most of that is substitutable. Silver is fundamentally different. Nearly 60% of silver demand comes from industry, concentrated in applications where it's functionally irreplaceable. That single distinction changes everything about silver investing — and about how you should think about it as an asset class.
This isn't new. Silver's been used in electronics for decades because of its unique properties: the highest electrical and thermal conductivity of any metal, superior reflectivity, and antimicrobial characteristics that can't be easily replicated.
What IS new is the scale.
Silver's industrial consumption hit 680.5 million ounces in 2024—a record high for the fourth consecutive year. That's 59% of total silver demand, up from roughly 40% just two decades ago. (Full 2025 figures are expected in the Silver Institute's World Silver Survey in April 2026 — preliminary estimates suggest another record year.)
And unlike gold—which sits in vaults and around necks—silver's demand is structural and accelerating. Companies building solar panels don't get to choose whether to use silver. Electric vehicle manufacturers can't easily substitute. Data centers powering AI can't function without it. This isn't investment demand that disappears when sentiment shifts, or jewelry demand that fades when prices rise. It's industrial consumption driven by government mandates and technological necessity.
And the demand is growing—fast.
The Industrial Transformation: A 20-Year Shift
To understand where silver demand is heading, you need to understand where it's been.
2000: The Old Demand Structure
- Total Demand: ~890 million ounces
- Photography: 35% (~311M oz)
- Industrial: 40% (~356M oz)
- Jewelry: 20% (~178M oz)
- Coins/Investment: 5% (~45M oz)
Silver's largest use was photography—film, x-rays, printing. Kodak alone consumed over 50 million ounces annually. Industrial applications existed but were secondary.
2024: The New Demand Structure
- Total Demand: ~1,160 million ounces
- Industrial: 59% (~680M oz)
- Jewelry: 18% (~209M oz)
- Coins/Investment: 16% (~191M oz)
- Other: 7% (~80M oz)
Photography has essentially disappeared. Industrial demand now dominates—and it's concentrated in specific high-growth technologies: solar panels (19% of total demand), electronics and semiconductors (30%+), electric vehicles, medical applications, and 5G infrastructure.
This isn't just growth—it's transformation.
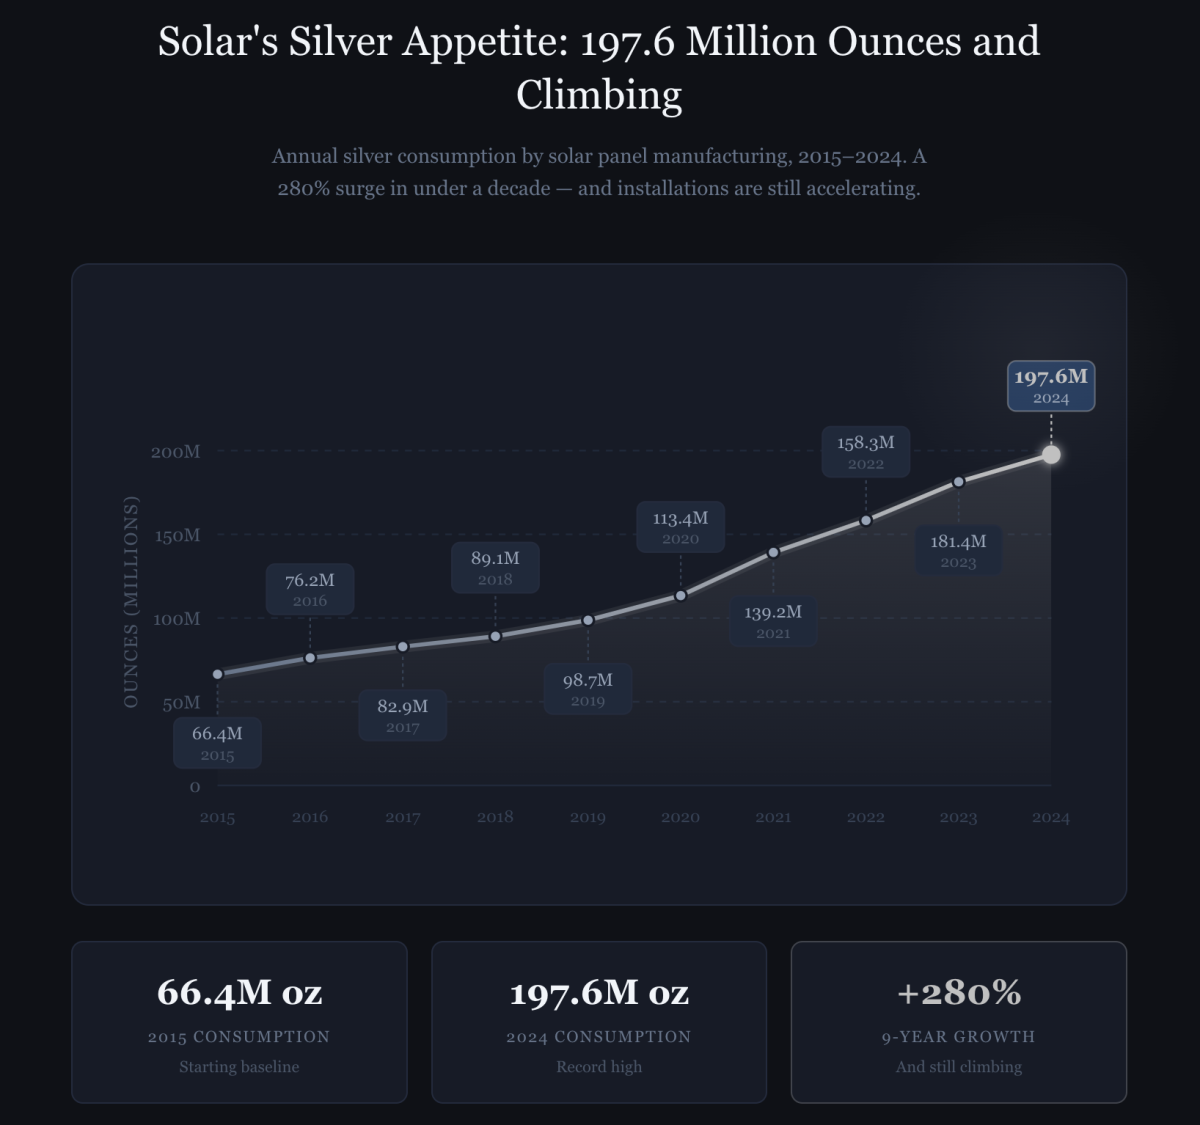
Solar: The 197.6 Million Ounce Gorilla
Solar panel manufacturing is now silver's largest single industrial application—and it's not even close.
- 2015: 66.4 million ounces consumed
- 2020: 113.4 million ounces
- 2024: 197.6 million ounces
- Growth: 280% in nine years
To put this in perspective: solar panels alone consume more silver than all government mints worldwide produce in coins combined.
Why solar panels need silver: Silver paste is screen-printed onto silicon wafers to form the conductive pathways that collect electrons. It requires the highest electrical conductivity of any metal, thermal stability over 25+ years of use, and seamless compatibility with silicon at manufacturing scale. No other material matches this combination.
The thrifting paradox: Solar manufacturers have reduced silver content per panel significantly—from ~130mg per watt in 2016 to ~85mg in 2024. So why is total consumption soaring? Because installations are growing far faster than thrifting can offset:
- 2015 Global Solar Capacity: 227 GW
- 2024 Global Solar Capacity: 2,247 GW (crossing the 2 terawatt milestone)
- H1 2025 alone: 380 GW of new capacity added — 64% more than the same period in 2024
- Growth since 2015: Nearly 10x
Even with 35% less silver per watt, the massive increase in installed panels means total silver consumption has nearly tripled — and 2025 is on track to shatter installation records yet again.
The mandates that lock in demand: This isn't optional, market-driven demand. The EU targets 750 GW of solar capacity by 2030 (currently at ~260 GW). China installed a staggering 357 GW in 2024 alone — and has already hit its combined 2030 solar and wind target of 1,200 GW six years ahead of schedule, meaning its new baseline for ambition has reset even higher. The U.S. Inflation Reduction Act commits $369 billion for clean energy with tax credits through 2032. The International Energy Agency forecasts global solar capacity could exceed 7 TW by 2030 — more than three times today's installed base.
Even assuming continued reductions in silver content per watt, conservative estimates put solar silver consumption at 220–250 million ounces annually by 2030. That's 10–25% more than today's already-record consumption.
Can solar substitute away from silver? Copper and aluminum are being researched as alternatives, and new cell architectures show promise. But the reality: research to commercial production takes 5–10 years minimum, high-efficiency panels (where the market is moving) actually need more silver, and substitution only becomes economical at prices most analysts estimate above $150–200 per ounce. Solar will continue consuming massive silver quantities for the next decade at minimum.
Electric Vehicles: The 2x Silver Multiplier
Electric vehicles don't just use more electronics than traditional cars—they use fundamentally different electrical systems that are silver-intensive.
- Traditional ICE vehicle: 15–28 grams of silver
- Battery Electric Vehicle: 25–50 grams of silver
- Nearly 2x the silver content
EVs use silver throughout their architecture: battery management systems (safety-critical monitoring), electric drive motors and inverters, high-current DC fast charging contacts, power distribution relays, and increasingly sophisticated driver assistance electronics.
The growth trajectory:
- 2015: 1.3 million EVs sold globally
- 2020: 3.2 million EVs sold
- 2024: 17 million EVs sold
- 2025: 20.7 million EVs sold — one in four new cars globally
- 2030 (projected): 40–50 million EVs sold
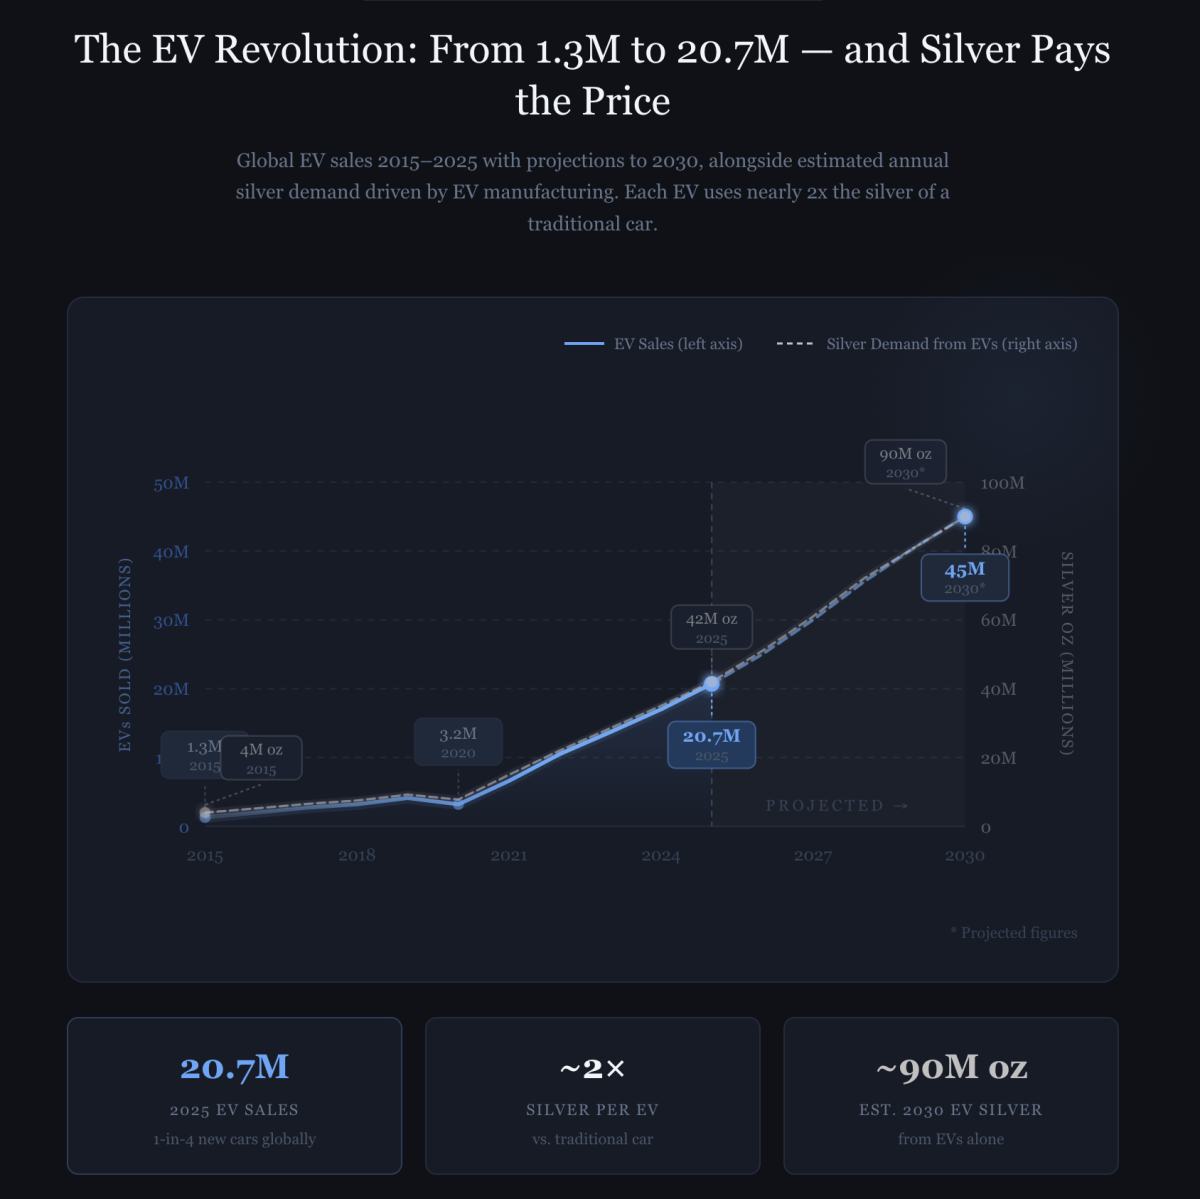
If this trajectory holds, annual silver consumption from EVs grows from ~20–25 million ounces today to ~70–90 million ounces by 2030. That's a 50–65 million ounce increase in six years from this single application alone.
Like solar, EV adoption is being driven by government mandates, not just market forces. The EU bans new ICE vehicle sales by 2035. California and 16 other U.S. states follow suit. China targets 40% of new vehicles as New Energy Vehicles by 2030 (already at ~35%). Major automakers have invested hundreds of billions in EV platforms—this isn't reversible.
Will manufacturers substitute away from silver? Consider the math: a $50,000 EV with 40 grams of silver at $93/oz means silver costs roughly $120—less than 0.25% of the vehicle price. At these levels, the engineering cost of substitution far exceeds any material savings. Aggressive substitution only becomes worth pursuing above $200+/oz.
Electronics & AI: The Demand Nobody's Talking About
While solar and EVs grab headlines, the largest industrial demand category remains electronics—and it's evolving in ways that are accelerating silver consumption.
Traditional consumer electronics (smartphones, laptops, TVs, appliances) consume an estimated 50–100+ million ounces annually. Each smartphone contains only 0.2–0.3 grams of silver, but at 1.4 billion units shipped per year, it adds up fast.
The genuinely new driver is AI computing infrastructure:
- 2019: ~2,000 data centers globally
- 2025: ~12,000+ data centers globally (U.S. alone has 4,165)
- 1,189 large hyperscale facilities operational as of Q1 2025, with 504 more in planning and construction
- Global data center capacity: 114 GW in 2025, projected to reach 200 GW by 2030 — nearly doubling
The four largest hyperscalers (Microsoft, Google, Amazon, and Meta) collectively plan to spend over $370 billion on data center infrastructure in 2025 alone — up from $244 billion in 2024. Each GPU server running AI models is silver-intensive — high-speed interconnects, thermal interface materials, power delivery systems. And unlike a smartphone (which replaces an older phone), data center capacity is additive. Every new facility adds to cumulative silver demand.
5G infrastructure adds another layer: each 5G base station uses significantly more silver than its 4G equivalent, with more antennas and higher-frequency RF components that demand better conductors. China alone deployed 3.8 million 5G base stations by end of 2024. Global deployment is expected to reach 15–20 million stations by 2030, representing 15–30 million ounces of silver demand annually.
The Demand That Won't Disappear
Twenty years ago, silver's largest use was photography. That demand disappeared almost overnight as digital cameras took over. Many investors reasonably ask: could solar and EV demand disappear the same way?
No — and the reason comes down to one fundamental difference: photography was optional consumer technology, but solar and EVs are government-mandated infrastructure with no alternative being proposed.
Photography was optional technology, consumer-driven, with no regulatory mandate and a superior alternative (digital). Solar and EVs are government-mandated, driven by climate commitments rather than consumer preference, backed by hundreds of billions in sunk manufacturing costs, and there's no alternative being proposed—fossil fuels are the problem being solved, not a replacement.
Photography demand could vanish because it was discretionary. Solar and EV demand is non-discretionary, policy-driven, and locked in for decades.
This creates a new demand structure with genuine price floor implications:
Non-discretionary industrial demand (~700–750M oz): Solar, EVs, core electronics, 5G, medical applications. This is 60–65% of total demand. It continues regardless of silver price or economic conditions.
Discretionary demand (~400–450M oz): Investment coins and bars, jewelry, some substitutable industrial applications. Cyclical and recession-sensitive.
Even in a severe recession, if discretionary demand falls 30–40%, total demand likely holds above 900–950 million ounces. Current supply (mine production plus recycling) runs approximately 1,010 million ounces. The market remains tight even in downturns.
This is structurally different from silver in 2000, when 35% of demand was photography (now gone) and industrial applications were largely substitutable. Today's demand creates a price floor that simply didn't exist in previous silver cycles.
Where This Is Heading
The demand picture points toward persistent deficits through the end of the decade. Industrial demand is on track to grow 4–6% annually. Total demand is projected to reach 1,050–1,100 million ounces by 2030. Supply, constrained by the fact that 72% of silver is produced as a byproduct of mining other metals, struggles to respond quickly to price signals. The result is a structural silver supply deficit that has now persisted for five consecutive years — and the silver outlook for 2026 and beyond shows no sign of meaningful relief.
Most analysts' silver price forecast puts gradual price appreciation toward the $120–180 range as deficits persist and substitution efforts slowly gain traction above $150/oz.

Final Thoughts
In 1999, Kodak consumed over 50 million ounces of silver annually for photography. That demand has almost entirely vanished.
In 2024, solar panels consumed 197.6 million ounces—nearly four times Kodak's peak—and this demand is growing, not shrinking.
We're in the early innings of a decades-long transition:
- Fossil fuel → renewable energy
- Internal combustion → electric vehicles
- 4G → 5G → 6G
- CPU computing → AI/GPU computing
Every one of these transitions requires silver. Lots of it. And they're all happening simultaneously.
The supply side struggles to respond. The demand side is accelerating. Government mandates, manufacturer commitments, technological dependence, and no easy substitutes combine to create a structural imbalance that didn't exist in previous silver cycles.
Understanding industrial demand isn't just about knowing "59% is industrial." It's about recognizing that silver has transformed from a monetary metal into a critical material essential to the technologies defining the 21st century. Gold stores value. Silver builds the future—and that's a fundamentally different investment proposition.
And those technologies aren't going anywhere.
Connecting Supply, Demand, and Investment Strategy
Industrial demand is only half the silver story. The supply side is where things get truly alarming—and where the real investment opportunity comes into focus.
To fully evaluate silver as an investment, you also need to understand:
- The supply constraints: Why production grew only 0.9% despite prices tripling. The 72% byproduct constraint that prevents meaningful supply response. Five consecutive years of deficits totaling 800 million oz.
- The timing and valuation tools: How to use the gold-silver ratio for tactical entry points. Whether silver is still a buy after the 147% rally. Inflation-adjusted context ($50 in 1980 = $170–180 today). (See also: How to Use the Gold-Silver Ratio to Time Silver Investments)
- The investment execution: Physical bullion vs. ETFs vs. mining stocks vs. IRAs. Portfolio allocation for different risk profiles. Tax optimization strategies.
- Full scenario analysis: Price trajectory modeling through 2030, risk factors, and the key indicators to watch.
I compiled all of this into The Silver Investing Guide—a comprehensive 50-page analysis bringing together supply fundamentals, demand drivers, investment strategies, and portfolio management frameworks.
Download The Silver Investing Guide (Free)
What's inside: complete supply deficit breakdown · gold-silver ratio strategy with historical validation · the 147% rally explained · investment methods comparison · portfolio allocation frameworks · analyst price forecasts and the math behind them · risk assessment and scenario planning
The guide is free—just enter your email to download it. You'll also receive daily precious metals market analysis alongside 30,000+ subscribers. Unsubscribe anytime.
Also read: After Surging to $121, Is Silver Still a Good Investment? | How to Use the Gold-Silver Ratio to Time Silver Investments

Darren Capriotti brings over a decade of specialized market analysis experience to the precious metals sector, with particular expertise in gold and silver market dynamics. His analytical foundation was built during his early career as a commodities research analyst for a mid-tier investment firm, where he developed sophisticated models for tracking precious metals price movements and supply chain disruptions. His background in econometrics and statistical modeling, coupled with extensive field research into mining operations across North America, provides him with an unusually comprehensive perspective on precious metals markets. You can reach Darren at dcapriotti@gold-eagle.com.
More from Silver Phoenix 500


