Silver (XAG/USD) Price Forecast: Failed Breakdown Signals Potential Upside Reversal
NEW YORK (March 16) Silver broke down from a small bear flag on Monday but failed to follow through. The decline reached a 15-day low of $77.02 before buyers regained control and drove price higher. It looks likely that silver will end the session in the top third of the day’s range while completing a potential bullish hammer candlestick pattern with a high of $81.48. The signal gains significance as support appeared shortly after the metal completed a 78.6% Fibonacci retracement of the prior internal upswing at $77.21.
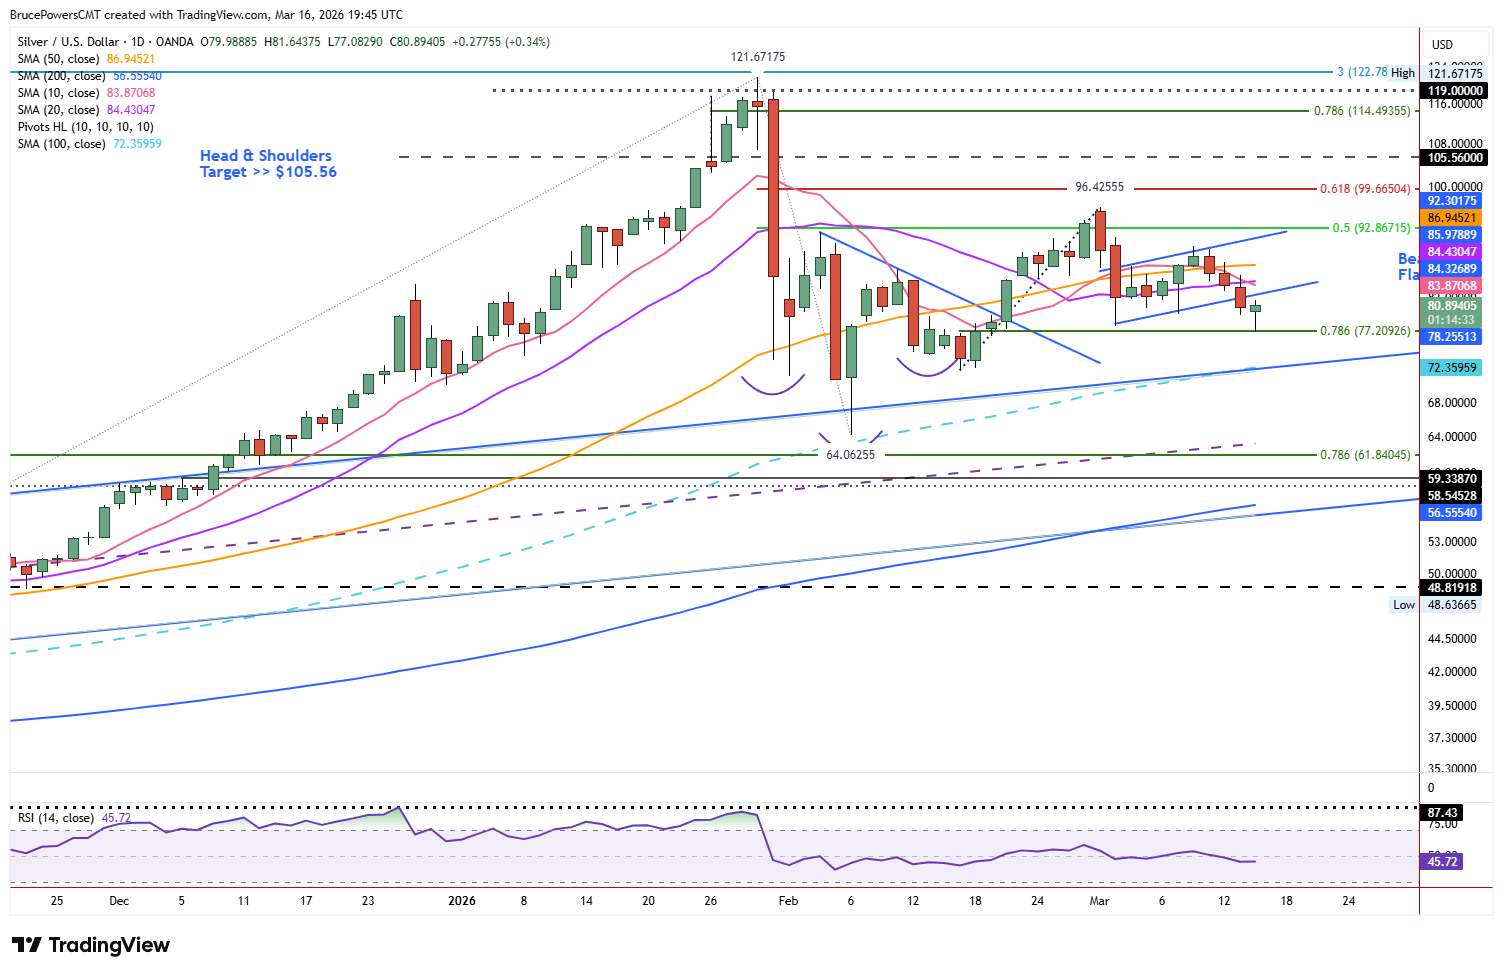
Spot silver daily chart shows bear flag breakout and support at 78.6% Fib retracement. Source: TradingView
Prior Breakout Context
The breakdown of the small flag may have greater bearish significance, depending on how recent price action is interpreted. Earlier, an upside breakout of an inverse head and shoulders bottom pattern triggered on February 20 above $79.50. The subsequent rally reclaimed both the 50-day and 20-day moving averages, before establishing a lower swing high at $95.43 and then turning lower.
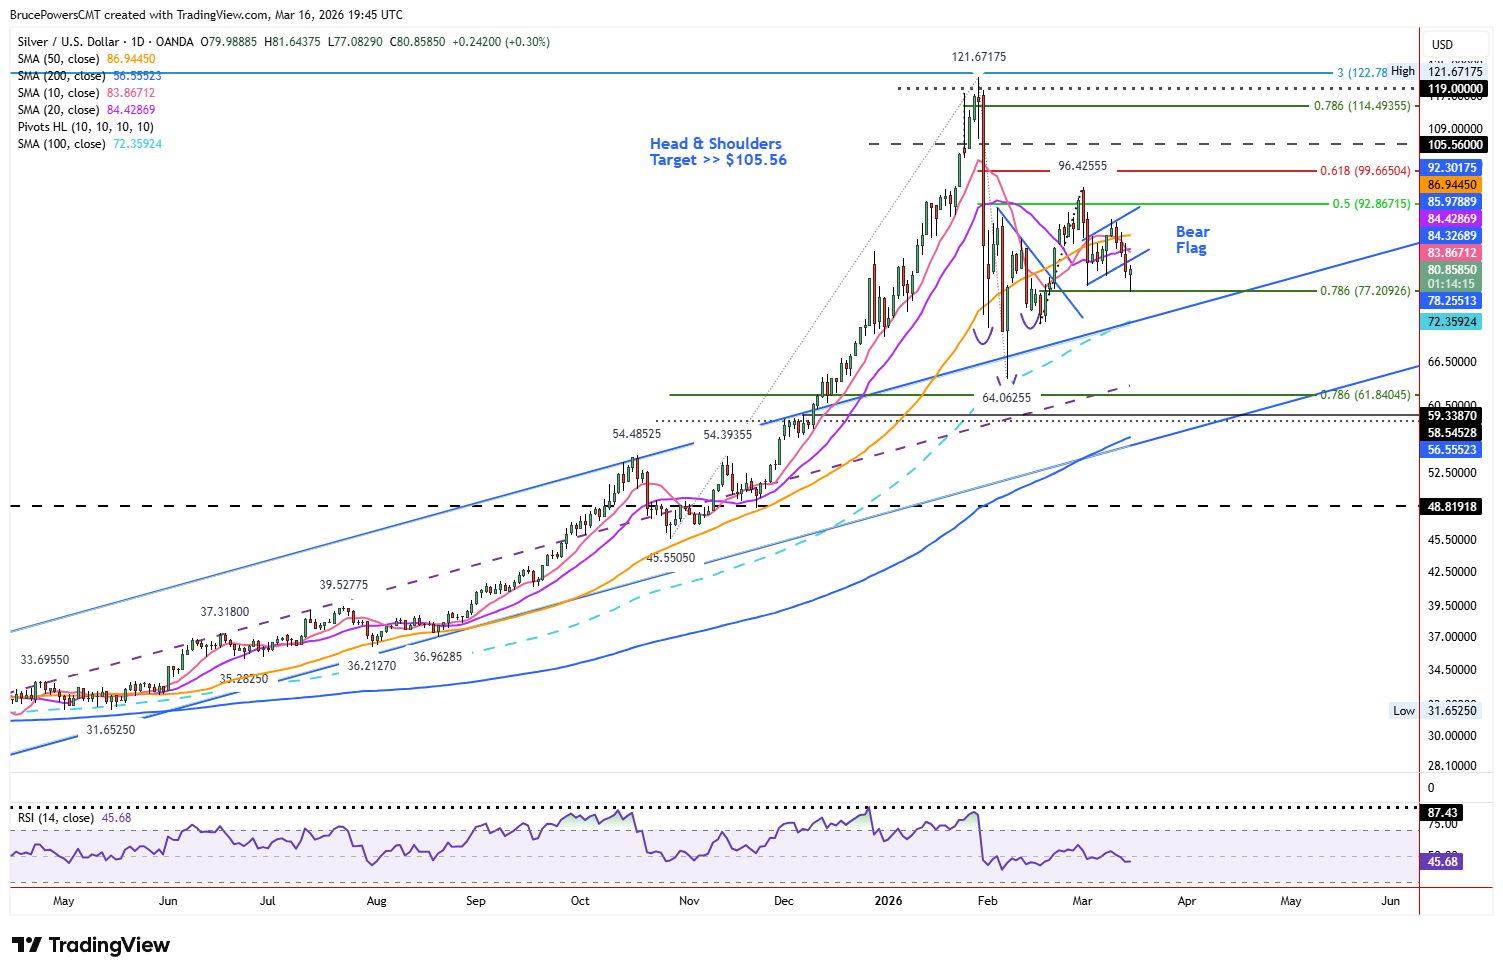
Spot silver daily chart should first pullback following bullish breakout of inverse head and shoulders pattern. Source: TradingView
Failed Pattern Raises Reversal Potential
A first leg down from that high resulted in the bottom of the flag formation at $77.96. It was broken during Monday’s initial slide but not confirmed with a daily close below it. Given the bullish price action following the bearish trigger, downside continuation failed confirm. Therefore, it is possible that the second leg down has already found a bottom. This means that signs of strength should be taken seriously if they confirm. A rally would be in response to a failed breakdown since failed patterns can lead to sharp moves in the opposite direction.
Head and Shoulders Target Remains in Play
The bullish scenario is supported by the head and shoulders bottom since this is the first pullback since the breakout of the pattern. An initial measuring objective from the pattern points to a possible upside target around $105.56. However, the 61.8% Fibonacci retracement at $99.67 would need to be tested.
Rising Wedge Breakdown Still a Risk
An alternative interpretation identifies a rising bearish wedge, with a breakdown triggering on Friday after the lower boundary line failed with a confirmed daily and weekly close below the line. This suggests further downward pressure, but only if support near Monday’s low fails to hold.
Key Levels Signal Strength
In either scenario, a decisive breakout above Friday’s high of $85.29 would provide the first sign that demand may continue to strengthen. A subsequent rise above the lower swing high of $89.85 would confirm strength and reinforce the possibility that Monday’s failed breakdown marks the start of a renewed upside advance.
FXEmpire


