Gold (XAUUSD) & Silver Price Forecast: Safe-Haven Exit? Why Gold is Diving
LONDON (March 27) Precious metals are caught up in a bit of an oddball situation in 2026. All the usual warning signs – escalating global tensions, say – are actually causing more people to bail rather than buy in. Gold just took a sharp dive from its peak in early March around $5,200-$5,400 an ounce – that was an absolutely screaming hot run by the way, one of the most dramatic commodity rallies in the books – due largely to people running for the exits on leveraged ETFs and margin calls pretty much overwhelming any safe-haven buying that might have been happening.
Meanwhile the dollar is really taking off, and an increasingly hawkish Fed stance on inflation – which is getting a bit of a push from high oil prices, ironically – has people spooked about non-interest bearing assets. Thing is though, there doesn’t seem to be a whole lot of structural demand drying up here. Central banks are still snapping up gold at a pace we haven’t seen since the 1960s, and big banks like J.P. Morgan, Deutsche Bank, and UBS are all still sticking with their 2026 price targets ranging from $5,400 to $6,300 an ounce – they’re just citing a bunch of usual suspects like the de-dollarization trend, sovereign fiscal imbalances and the like.
Things are a bit more complicated with silver. With its value dropping around 44% from its all-time high hit in January 2026 near $121.64, and basically being both a store of value and an industrial input for all sorts of things like solar panels, EVs and semiconductors, this metal’s like a ticking time bomb just waiting for the mood to shift. You can see that the gold-silver ratio has widened up and that’s making people start to think that maybe silver is a bit undervalued, attracting a fair amount of contrarian institutional interest.
Most analysts are seeing this sell-off as a pullback within an otherwise structurally bullish trend.
Gold Trapped Beneath Descending Channel Resistance – $4,475 Rejection Keeps Bears in Control
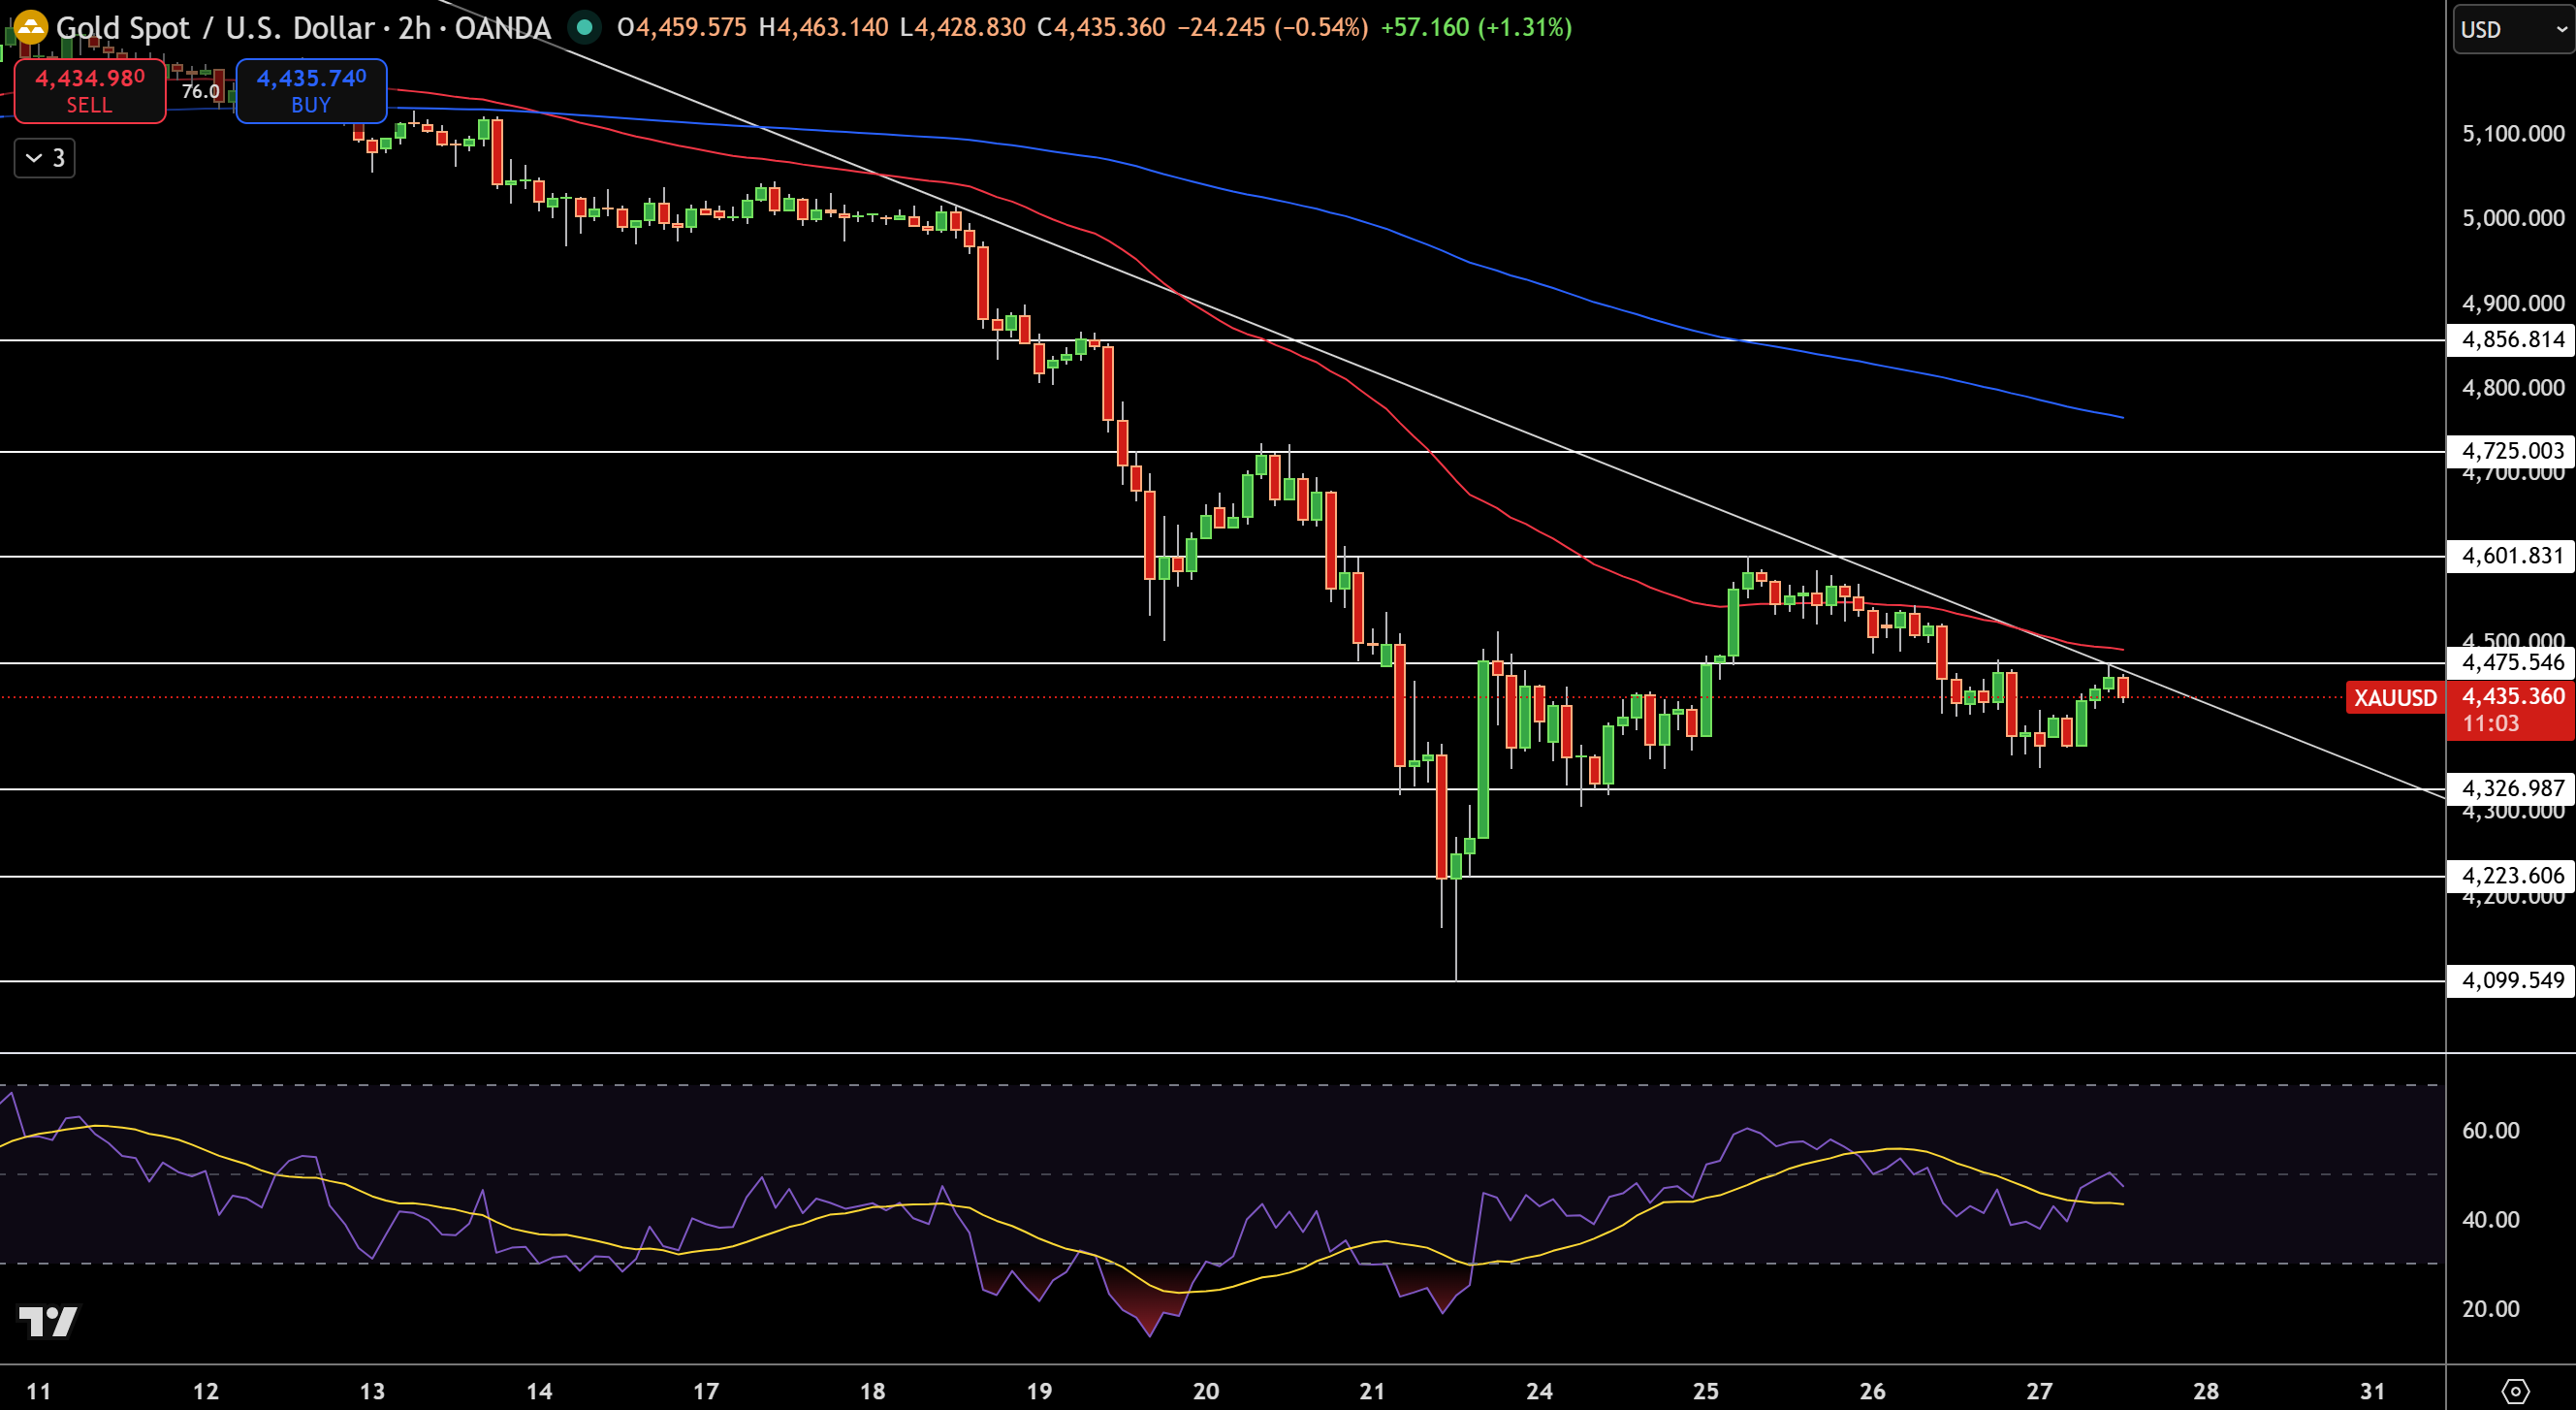
Gold – Chart
Take a look at the gold price in the 2-hour timeframe – does a nice neat descending channel with the price just getting slapped back down time and time again at the falling trendline. This just happened at $4,475.546, and now that’s a pretty solid wall of resistance that the bears are loving.
The red EMA is still sloping downward and sits above the price, and the blue EMA is still lurking just above $4,800, which basically just confirms the bearish structure. You saw the price drop down to $4,223 a few days ago, and that formed a little hammer of a candle that triggered a bounce, but then when the price tried to recover to $4,601, the three bearish candles after that pretty much screamed “this is a sell”. And to top it all off, the RSI is still below 50, and that yellow signal line just failed to stay above the 50 line.
Sell at $4,475, stop loss at $4,602, looking for a price target of $4,327.
Silver Descending Channel Tightens at $70.34 – Bears Hold the Trendline as Breakdown Risk Mounts
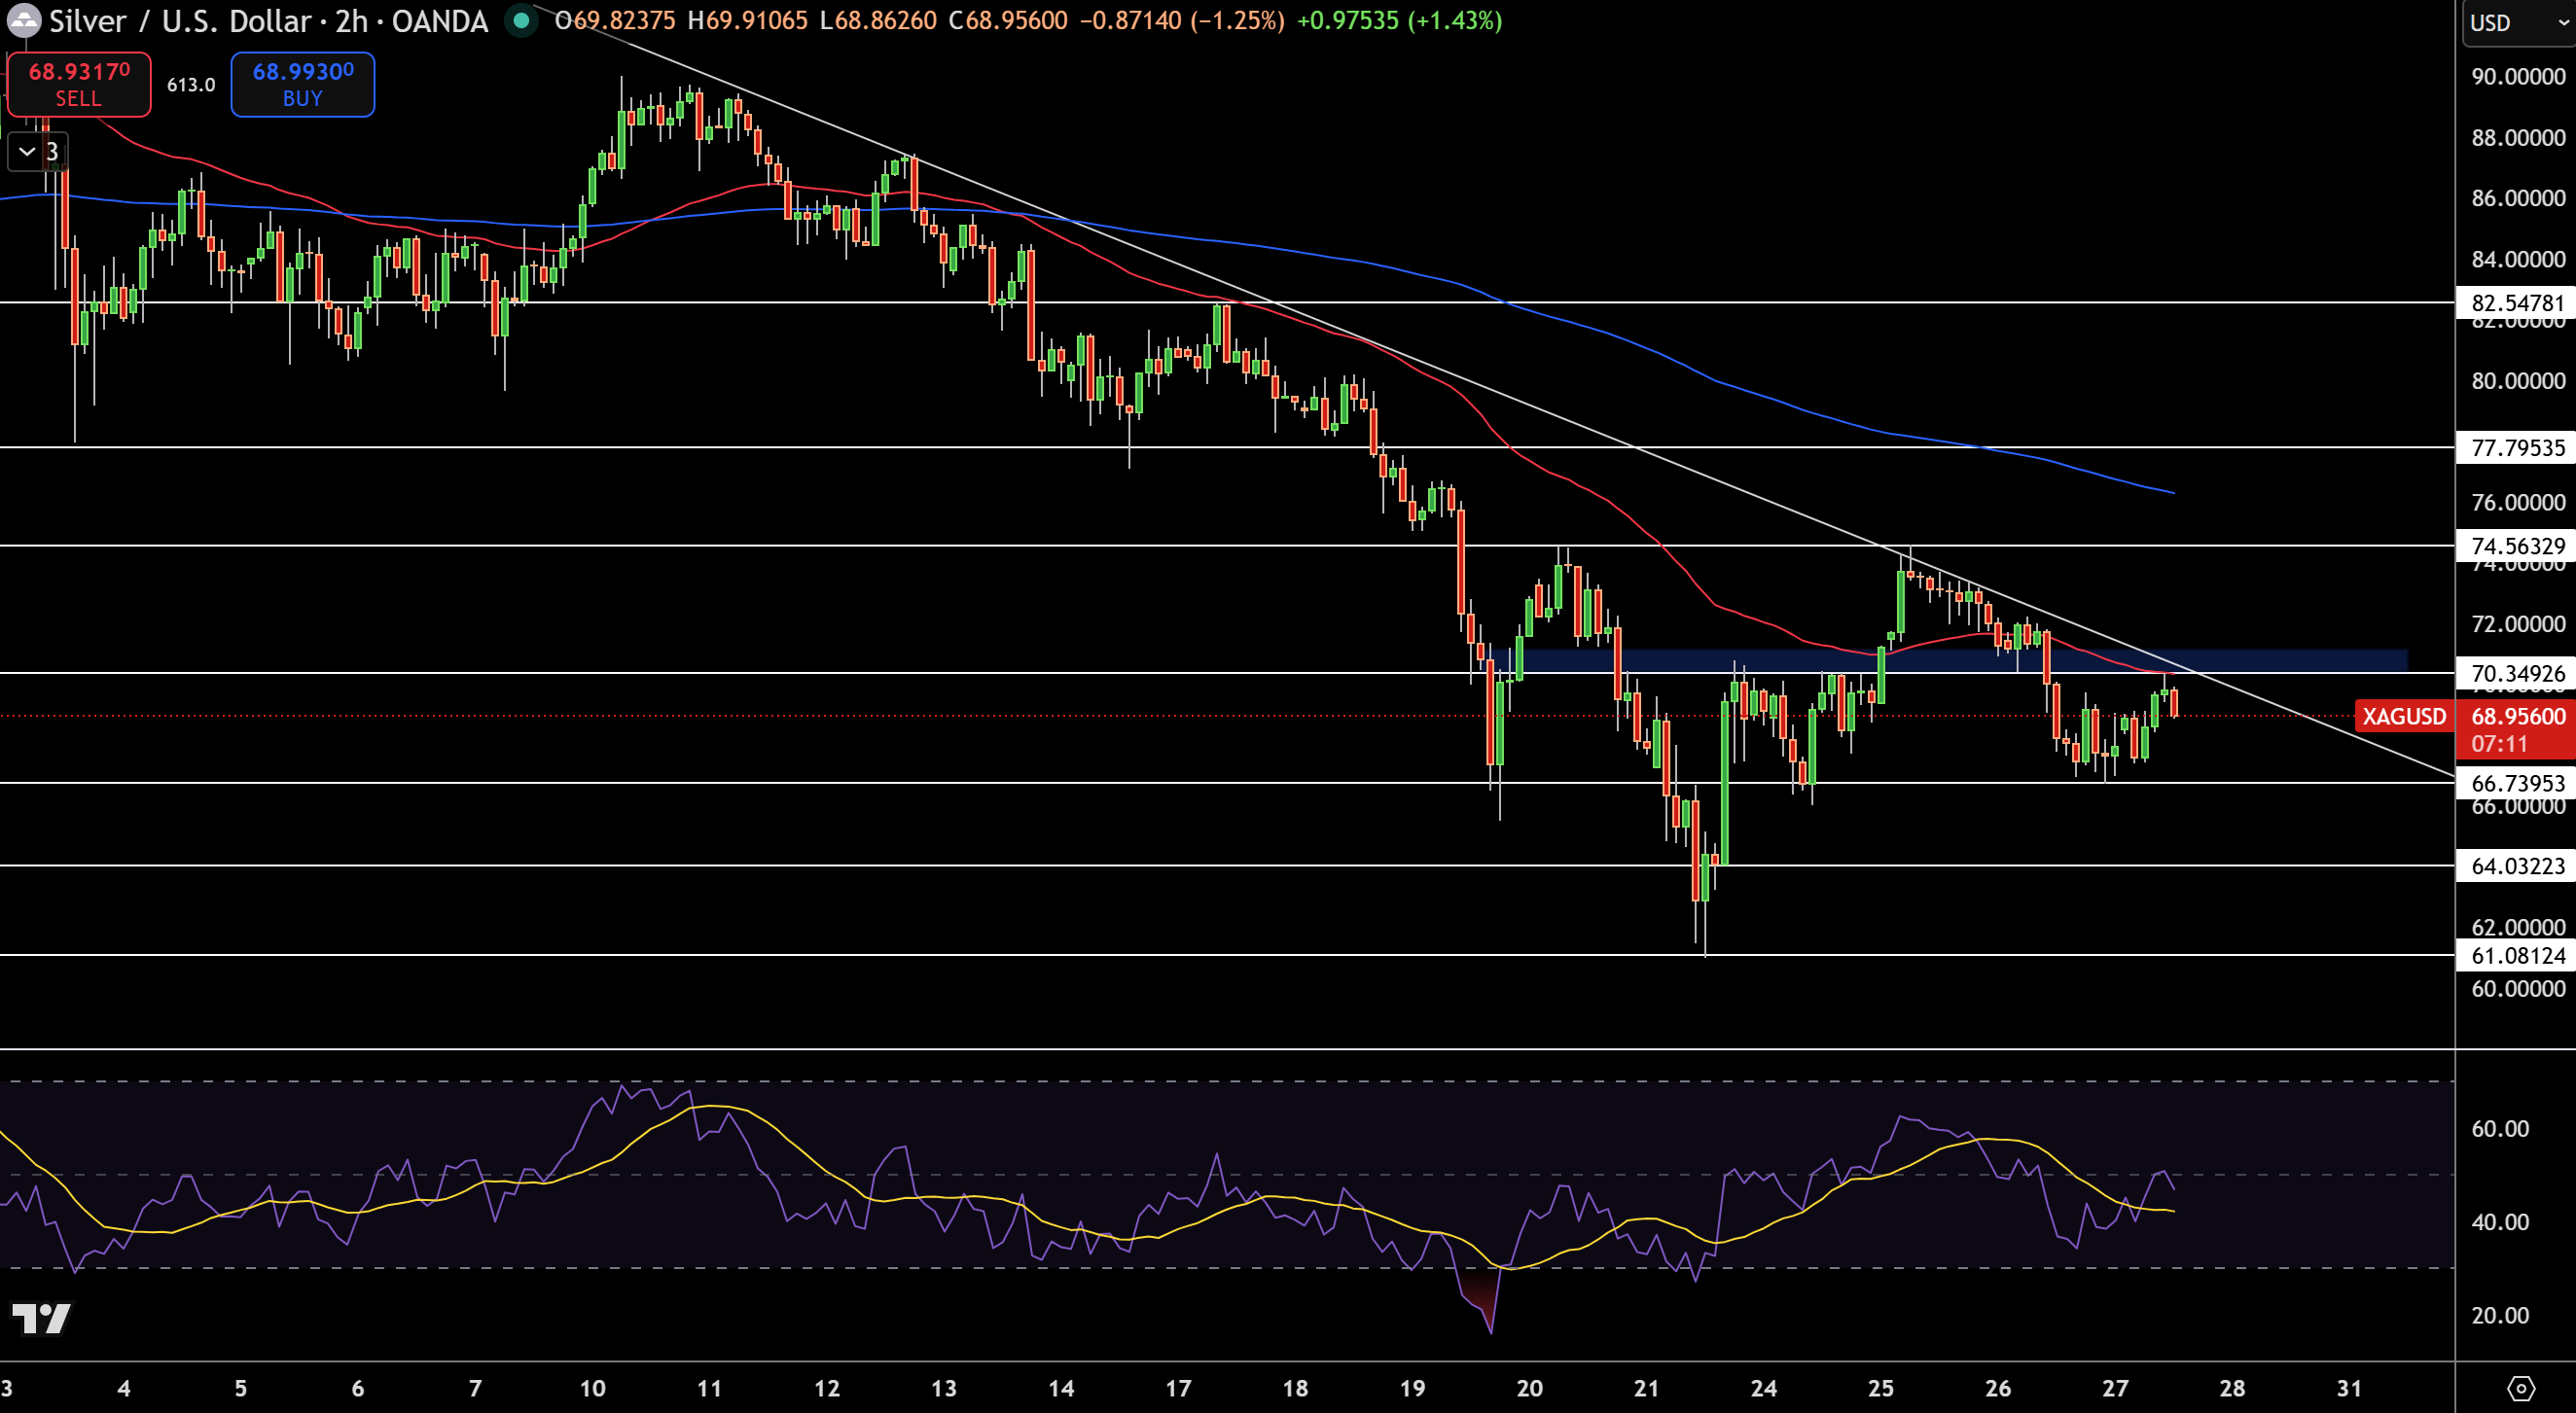
Silver – Chart
On the 2-hour silver chart, which shows a descending channel pretty much stuck in place – the price is just slowly grinding lower beneath the falling trendline at $82.54, and it’s now getting a little too close for comfort to that critical $70.34 support level (that blue area down there). Both those red and blue EMAs are still sloping down, which just tells you the bearish structure is still very much in place.
You’ve got spinning tops and doji formations just popping up everywhere, which is basically just code for “people are just too darn unsure what’s going on to make a decision”. RSI got pretty darn oversold down at 20 a while back, had a little bounce up to 60, but then promptly went back below 50 – that’s a pretty clear sign of a fail. And if silver were to smash through $70.34, it would leave the path wide open to $66.73
FXEmpire


