Silver Price Forecast: XAG/USD sets for third straight negative weekly close
LONDON (March 20) Silver price (XAG/USD) trades in a tight range around $72.80 during the European trading session on Friday. The white metal holds onto Thursday’s recovery move, which was driven by weakness in the US Dollar (USD). Technically, a lower US Dollar makes the Silver price an attractive risk-reward trade for investors.
On a broader note, the precious metal is uncertain and looks set to end the week on a negative note. This would be the third straight negative closing.
Silver price remains under pressure this week as global inflation expectations have de-anchored due to higher oil prices in the wake of the war in the Middle East, which involves the United States (US), Israel, and Iran. Oil prices gained sharply as Iran closed the Strait of Hormuz, as part of retaliation against the joint assault by the US and Iran, through which 20% of global oil is shipped.
In addition to the closure of the Strait of Hormuz, attacks from Iran and Israel on several energy facilities in the Middle East have prompted energy supply concerns, which have eventually contributed to higher energy prices.
Meanwhile, global central banks have also warned of energy-linked upside inflation risks and have argued against reducing interest rates in the near term.
Theoretically, signals of an extended pause by various central banks on the monetary policy outlook diminish the appeal of non-yielding assets, such as Silver.
Federal Reserve (Fed) Chair Jerome Powell said in the post-monetary policy meeting conference on Wednesday. “Higher energy prices will push up inflation in the near term, but the effects remain uncertain,” Powell said.
Silver technical analysis
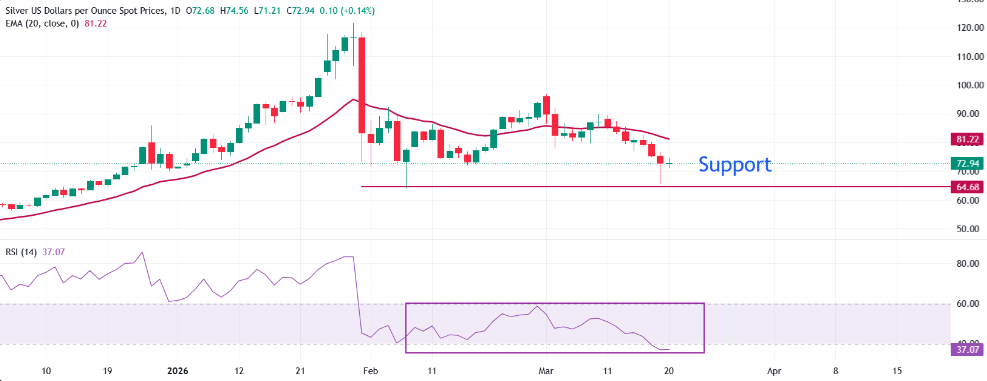
XAG/USD trades flat at around $72.80 at the press time. The near-term bias is bearish as price extends its decline below the 20-day Exponential Moving Average (EMA), which now tracks above spot and acts as dynamic resistance near $81.22. The sequence of lower closes from the mid-$90s to the low-$70s underscores persistent selling pressure, while the RSI slipping below 40.00 for the first time in 11 months is confirming downside momentum without reaching oversold territory. This setup keeps sellers in control unless the price can recover and stabilize back above the broken average.
Immediate resistance appears at $76.50, where a prior reaction high aligns with the descending short-term structure, followed by a stronger barrier around $81.00, capped by the 20-day exponential moving average. A sustained break above $81.00 would weaken the current bearish tone and open a move toward the $84.00 area. On the downside, initial support is located at round-level $70, followed by Thursday's low of $65.51.
FXStreet


