Silver (XAG/USD) Price Forecast: Bulls Target $100 and Beyond
NEW YORK (March 2) Silver exceeded last week’s high on Monday, reaching a new high of $96.43 for the bounce. A breakout above a resistance zone at $94. 24 was also recovered, providing optimism for the bulls. Buyers subsequently failed to retain control and sellers took over, dropping silver below Friday’s low to $86.51 for the day. Although this is not bullish short-term behavior, silver remains positioned in a bullish posture, consolidating above moving average support. Moreover, the faster 10-day moving average is showing strength by crossing above the 20-day moving average. And it is poised to rise above the 50-day moving average currently.
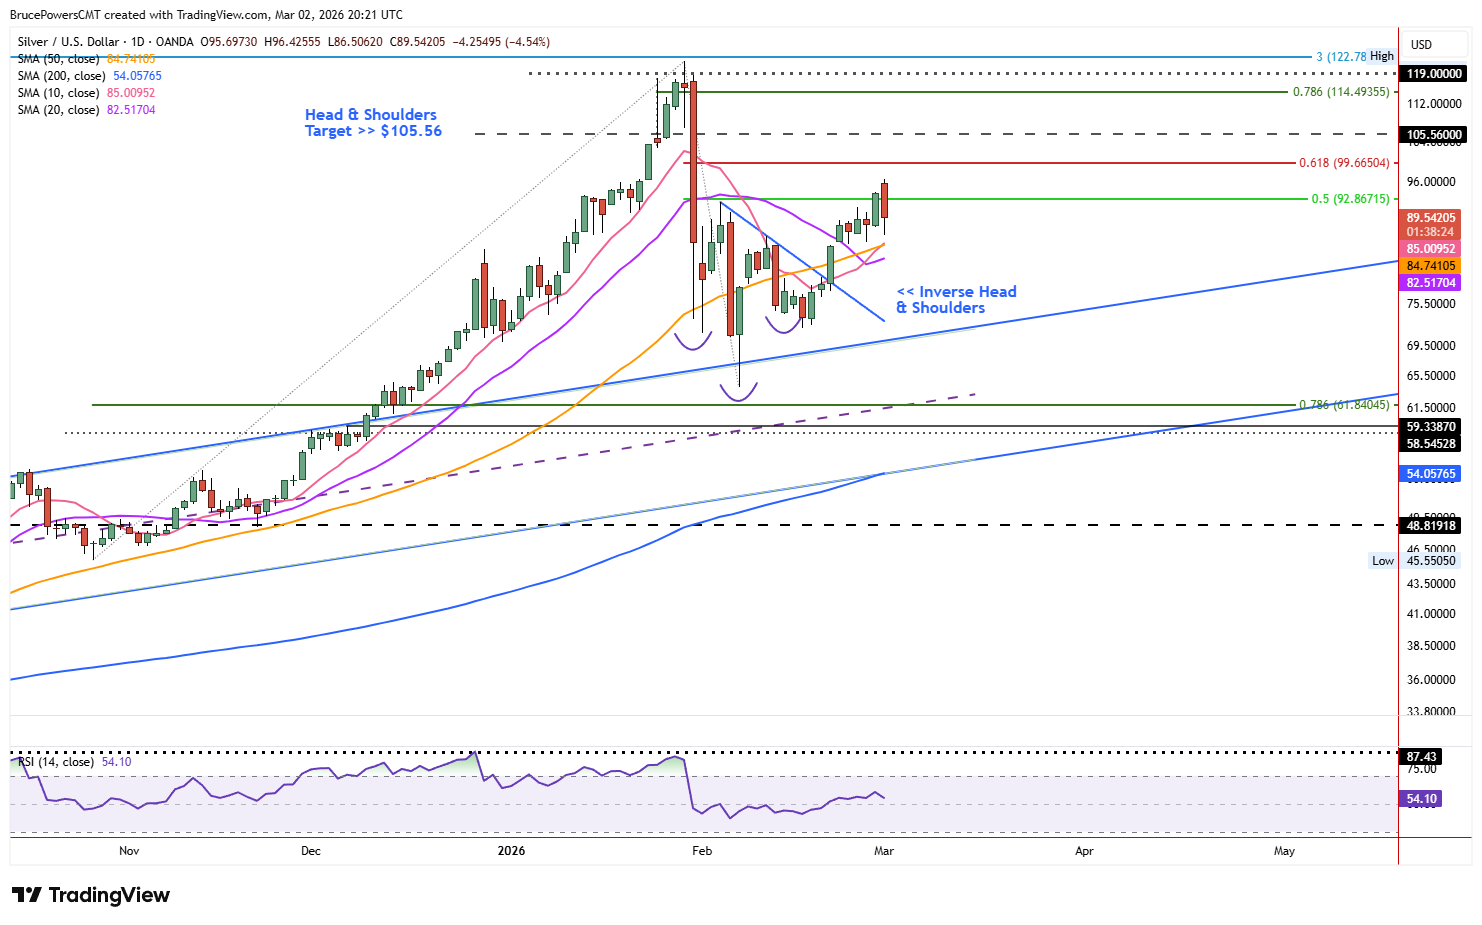
Spot silver daily chart shows consolidation above moving averages. Source: TradingView
Consolidation and Trend Structure
A relatively tight consolidation range, near support of key moving averages, is bullish in general. But more so when price is sustaining a reclaim of the averages following a bearish correction. In addition, a bullish breakout of an inverse head and shoulders reversal pattern triggered a couple weeks ago, which led to the recovery of the moving averages. This is a sign of growing demand that suggests silver may eventually challenge the recent record high of $121.67. Nonetheless, a couple of the targets below that high look likely to be hit.
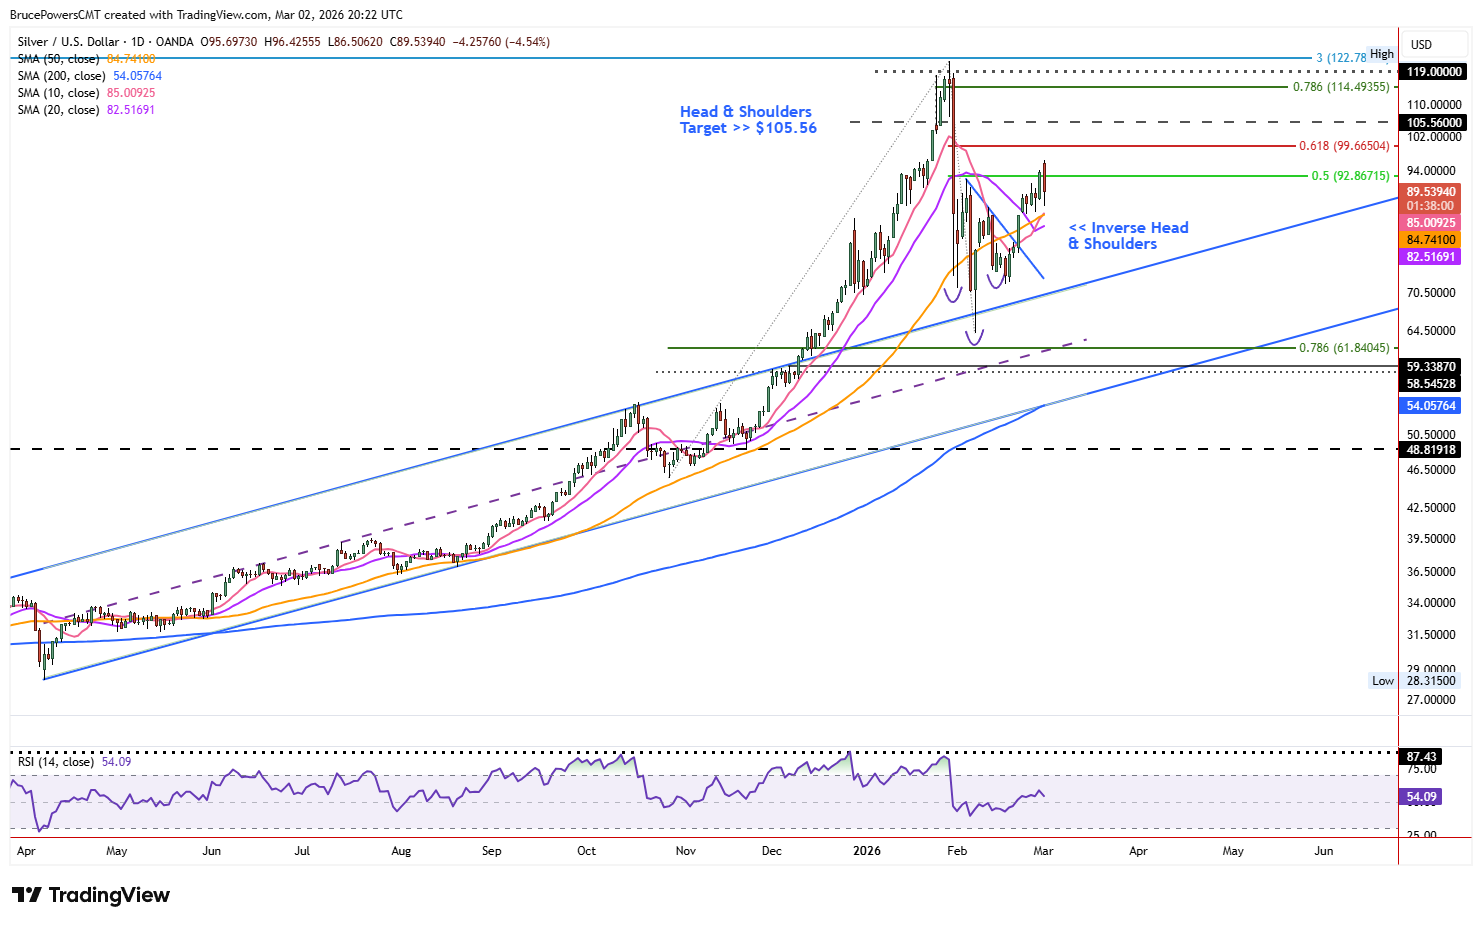
Spot silver daily chart shows successful test of support at top of rising channel. Source: TradingView
Support Levels and Weekly Trend
Key near-term support is at last week’s low of $84.94 and the 20-day moving average, now at $82.49, which has started to rise. The weekly chart has an early pattern of higher weekly lows and higher highs. A higher weekly high was reached today, with a higher low yet to be determined. Given Monday’s extension of the rally to a new high, the next likely target is the 61.8% Fibonacci retracement at $99.66.
Pattern Targets and Fibonacci Projections
The head and shoulders bottom pattern provides a potential target by taking the price distance from the head to the neckline and then adding it to the breakout level. This calculation provides a possible target near $105.56. Given recent volatility, however, the 78.6% Fibonacci retracement at $114.49 has a chance of being reached as well. The current advance is in reaction to a sharp 47.6% drop in the price of silver. Since the $64.06 low in early February, the advance has been orderly and constructive, suggesting the bullish momentum might spike be sustained toward the higher Fibonacci zone.
FXEmpire


