Where Are Gold And Crude Oil Headed Now?
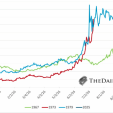
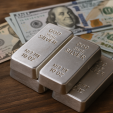
New York (July 17) Gold has been all over the news recently, and SPDR Gold Trust (GLD) has reached its highest price level ($135.55) in almost six years, since September 2013. This has occurred despite the strength of the US dollar, as during many periods, a strong dollar has been negative for gold.
High inflation also tends to increase the buying in Gold. Curiously, Gold prices have also been going up, despite low rates of inflation. Last week’s Consumer Price Index edged up in June, but falling energy prices offset some increases in rent, clothes, and autos. Similarly, the Producer Price Index also came in as expected, but the personal consumption readings (excluding food and energy) were also up, by 0.5%.
All of this points to a potential increase in some inflationary indicators, such as the PCE Core, which will likely be supportive of gold prices. But for more insight, let's take a look at the charts.
The Comex Gold Futures a month ago exceeded the July 2016 high (line a) at $1377.50. Prices have been consolidating from the high at $1442.90, recently testing the $1385 level. Once above the recent high, the next resistance is in the $1480-$1500 area.
Comex Gold Futures' weekly On Balance Volume (OBV) is in a strong trend, above its WMA and positive. Its weekly Herrick Payoff Index (HPI) has move above the resistance (line c), which goes back to 2017. The HPI did make a new high with prices, and is holding well above the zero line, consistent with positive money flow.
The September Crude oil contract closed up 4.7% last week, as worries over tropical storm Barry and increased tensions with Iran pumped up prices. The gains were in contrast to the International Energy Agency (IEA) forecast last week that surging US production would swamp global demand.
The downtrend on the weekly chart (line a) is now at $62.76, with the April high at $65.76. The 20-day EMA has flattened out and is now at $58.42. The weekly OBV made a new high early in the year, which is a positive sign. It moved above its WMA this week and is now looking more positive.
The future path of both gold and crude oil are likely to be impacted by the action in the US dollar. The rebound by the Dollar Index futures from the doji low two weeks may have stalled as the dollar closed lower last week. There is key support at 95.37, and a decisive break below this level would be negative.
The OBV on the dollar has failed to move above its declining WMA on the rebound, and shows a pattern of lower highs (line b). This is not a positive sign. The HPI dropped below support (line c), in early June and though it has moved barely above the zero line, it is still well below the declining WMA. A lower close this coming week would support the bearish case.
So far this week gold and crude oil are both lower while the dollar is higher. Of course the weekly close will be more important. The technical patterns in gold are clearly positive and weakness in the dollar should be supportive. The weekly indicators are not as strong on crude oil so I am waiting for clearer signals. This type of analysis on the commodity markets can be used to generate recommendations in the commodity-focused ETFs.
If you like my analysis of the commodity markets, consider trying the Viper ETF Report, which provides specific buy and sell advice on ETFs twice a week. The service is only $34.95 per month.
Forbes