This Confirms The Continuation Of Silver’s Rally
 share
share
 share
share
 share
share
 share
share
 share
share
On the silver chart is a classical major reversal pattern referred to as a Head and Shoulders Bottom. Major reversal patterns form after a downtrend, and its formation normally confirms a change in trend. Below is a silver chart (all charts from tradingview.com) with the pattern highlighted.
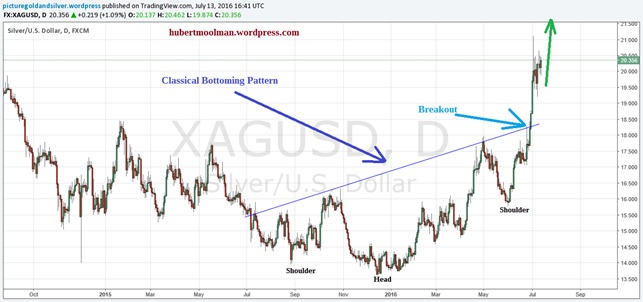
The existence of this pattern and its recent breakout confirm that the December 2015 bottom in silver is actually the bottom for the correction since 2011. This is a precious gift, if you were still unsure whether to get into silver or not. This was also confirmed by the fact that the USD/ZAR made a significant top very close to the December 2015 silver bottom USD/ZAR (a USD/ZAR top is a good signal to confirm a silver bottom).
The trend has changed, and prices will continue to rise over the coming months. The breakout has occurred, as pointed out, and it fulfilled all the requirements to be considered valid. The tricky part of this kind of pattern is the issue of whether price will retest the breakout area, which is around $18.
There is no sure way of knowing whether price will continue from where it is, or whether it will return to the breakout area, before resuming the rally. If, I tell you that price is more likely to continue from around these levels, rather than return to the breakout area, it would be nothing more than a guess.
If, I am wrong, and price retests the breakout area, you should take it as a great opportunity to get silver at an ideal entry point.
Another interesting thing about this pattern is the fact that it is upward sloping, which makes it extremely bullish. Furthermore, this pattern is at the trigger point, of a larger pattern on the silver chart previously pointed out.
The following fractal analysis supports the extremely bullish outlook:
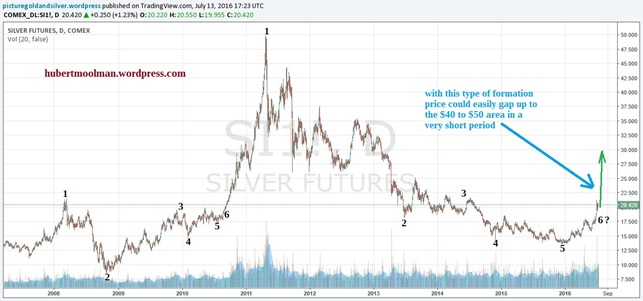
On the silver chart I have highlighted two patterns that appear similar. I have marked them 1 to 6 to show how they might compare. Both patterns start from a significant silver top. If the comparison is justified, then we are currently just after point 6, the point where a major breakout occurred (this concurs with the Head and Shoulders Bottom pattern breakout).
Due to the nature of the more current pattern (a flag-type formation) it could easily gap up $20/$30 in a very short time.
********
For more of this kind of analysis, you are welcome to subscribe to my premium service, or my free newsletter. I have also recently completed a Silver Fractal Analysis Report as well as a Gold Fractal Analysis Report.
share
share
share
share
share
More from Silver Phoenix 500

