Debt To Escape Velocity, NOT The Economy
 share
share
 share
share
 share
share
 share
share
 share
share
One of the biggest buzz-terms of the falsetto, faux recovery has been ‘escape velocity’. If there are any NASA engineers left, they can correct me, but I believe the term was used in physics or perhaps rocket science to describe the velocity an object must reach to break the hold of the Earth’s gravity. And you think Economics has some formulas? I’d LOVE to see the one for the real escape velocity.
Getting back to the economic version of rocket science (don’t even tell me that isn’t funny), we have been hearing the term for the past several years. Ironically it started with the central banking crowd, although they never quite told us what exactly the economy had to do to accelerate beyond the grasp of the ‘great recession’.
The point of this piece, however, is not to poke fun at seemingly benign policymakers and their silly words. The thrust of this article is going to be to demonstrate both visually and mathematically using some simple constructs that it is debt that has reached escape velocity and not the economy. Granted, myself and many others have written about this for years and if you’re reading this you probably have known it for that long.
However, one of the most important roles we play in this twisted game is to debunk the propaganda. So, where some stuffed shirt on television can just say something and expect to be taken at his word, we have to prove things. And prove them we will. Chances are good that we still won’t be taken at our word, but that is ok too. A few will understand and that’s all we’re looking for. So we begin.
All the data for this analysis comes from FRED – the research tool made available by the St. Louis Fed. Why use not-so-USFed data? When it comes to growth, unemployment, and inflation, all the data is junk except what you see and experience in your own sphere of influence. However, until recently, St. Louis published on the main page of their website an inflation calculator that showed a dollar in 1913 is worth around 4 cents today. Relatively honest We’ll admit even though the motives probably were not.
Secondly, we’re analyzing trends here, not specific data points. In the case of trend analysis, we can mathematically correct for bad or fudged data. Where we do that, we’ll tell you. Otherwise we’re just using their data as-is.
The 2000 Debt/Growth Picture
Even though 2000 was only 15 years and change ago, there have already been two major recessions in that time, the second of which never ended according to reasonable measures. As an interesting note, the St. Louis Fed has no say in ‘calling’ recessions. That job lies with the Bureau for Economic Analysis, which is a US Government agency.
Recessions are almost always called in arrears, which means that even Humpty Dumpty and the Three Stooges know we’re in one before BEA gets around to making the determination.
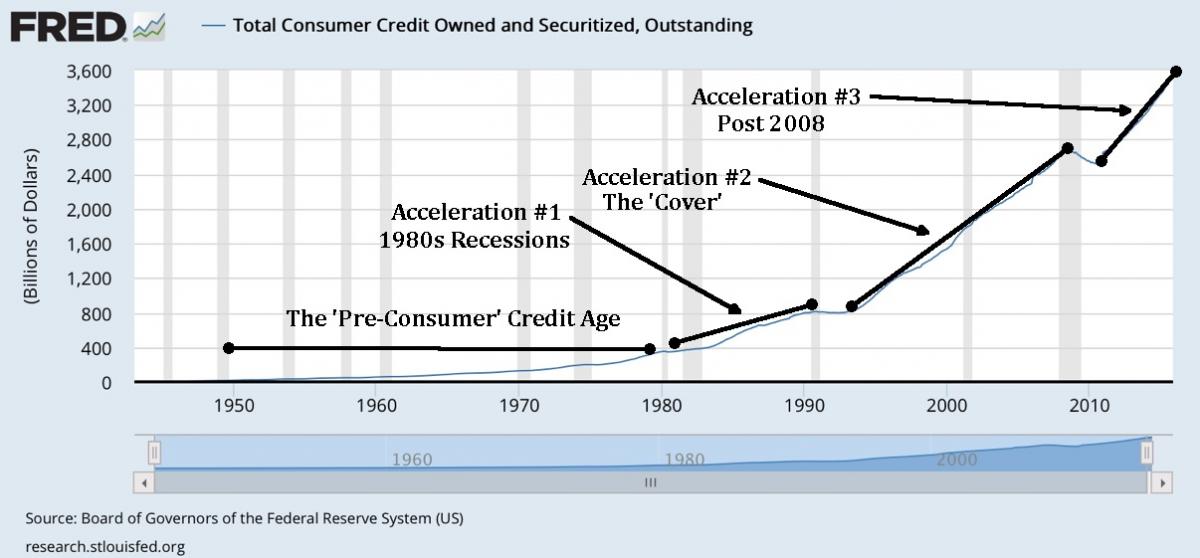
At the end of 1999, GDP stood at $9926.9 billion dollars or $9.926 trillion. The national debt was $5.846 trillion and the debt/GDP ratio was around 59%. There were already economists screaming that 59% was too high. The government scoffed and pointed to steadily growing GDP even though they failed to mention that much of that growth was the result of new debt, otherwise known as pass-through growth. It came with strings attached, namely that it must be paid back. This fact is usually not mentioned. Consumer credit at that time stood at $1.531 trillion. The consumer debt/GDP ratio was 15.4%. Consumer credit has been an interesting animal for sure. The progression has changed dramatically on three separate occasions as illustrated below:
Again we pick on the hapless consumer, but with good reason. We have long heard how the consumer in the United States represents 70% of the USEconomy. Fox News panelists named the American Shopper the person of the year before the ‘great recession’ so it makes sense that we at least keep tabs on the group most crucial to the survival of mankind.
Let’s take a closer look at the chart above. Notice that for many decades – since the series was initiated back in 1943 that there was very little consumer credit. There are a couple of reasons for that. First, credit cards were non-existent. So were store credit cards. Why? Mostly because they weren’t needed. The US was then the richest nation on Earth and its citizens enjoyed very low debt loads. You’ll notice that after 1960, the trend started to increase a bit. This coincides with the Great Society programs of the 60’s, the squandering of a nation’s wealth and the concomitant borrowing which resulted.
Consumer Credit – Acceleration #1 – Twin Recessions and Inflation
The 1980s featured a distinct increase in consumer credit as first store cards, then later credit cards, became more and more prevalent. But why would Americans feel the need to carry a balance? We understand the notion of convenience. But the balances became troubling and signaled a huge trend change. Back to back recessions didn’t help, but the one thing that became obvious – the inflation of the 1970s and early 1980s caught up to the country. First we sent Mom to work, then we started borrowing to fill the gaps in our daily living and to reach towards the living standard that we had consistently drilled into our heads by the MSM and Madison Avenue marketing. We are Americans doggone it and we are ENTITLED to it!
Consumer Credit – Acceleration #2 – The ‘Cover’
Then around 1990, coupled with a recession, America took a breath. Perhaps the instincts of our parents and grandparents kicked in and we realized the fool’s errand we were on. Next, during 1993, which oddly enough coincided with the Bureau of Labor Statistics major revision of the unemployment methodologies, the rate of borrowing literally exploded. Note the slope of the rate of accumulation remained almost constant from 1993 through 2009. Sixteen years of constant debt accumulation. Through the remains of the S&L crisis, the Latin American debt crisis in the mid 90s, the Russian mess and Long Term Capital Management in the late 1990s, the dot-com blowout and recession of the new century, and right through the housing debacle and stock market meltdown of 2007-2009. Nothing phased the American shopper-borrower.
Then something amazing happened. From late 2009 through the beginning of 2011, America paused once again. No, let’s correct that. America not only paused, but actually started paying DOWN some of the massive consumer debt it had accumulated. We aren’t going to belabor this point; it has been covered previously – click here. The repayment of debt on the part of the American consumer has terrible implications for the establishment and its fiat money system. Again, we have already covered this and provide a link for this resource here.
Consumer Credit – Acceleration #3 – Post 2008
Alas as in the early 1990s, America couldn’t - for whatever reasons – stick to the pay it down strategy. Consumer borrowing exploded once again. At a glance, it would appear as though the rate of accumulation is the same as that of 1993-2009, but mathematical analysis of the curves reveals that the slope is approximately 5% steeper since early 2011. Thankfully the rate is not as drastic as before, but don’t forget there are other ways to get money now also. People are able to borrow from 401 plans, take home equity loans and so forth as opposed to the more expensive forms of credit depicted in the Consumer Credit series. Not to mention the use of the various forms of government assistance. So we need to at least keep those factors in the back of our minds when looking at Consumer Credit because it doesn’t tell the whole story. But it tells enough.
Examination and Comparison – 1999 to Present
Now let’s compare some ratios. In 1999, the consumer credit/GDP ratio was 15.4%. Today, GDP is $18.221 trillion. It has increased by roughly 80% in the last 15 years. Consumer credit outstanding stands at $3.592 trillion. It has more than doubled. The consumer credit/GDP ratio now stands around 20%. While 15%-20% doesn’t seem like much of a big deal, it is still a 33% markup and don’t forget the other forms of credit available plus the blowouts in the use of government assistance.
Tearing all those numbers apart is well outside the scope of this type of missive, however, to make things just a tad clearer, let’s look at what happened to the national debt/GDP ratio. It went from around 59% at the end of 1999 to 106% this year. Please keep in mind that the debt numbers are a joke. They don’t include unfunded future liabilities. Using models from Laurence Kotlikoff, who estimates the actual GAAP (Generally Accepted Accounting Principles) present value of the national debt to be around $242 trillion at last check, the actual debt/GDP ratio is more like 1328%. It is nearly impossible to even wrap one’s brain around that one.
Looking at Growth… Where’s the Escape Velocity?
As we wrote above, at the end of 1999, the public debt aka national debt stood at $5.846 trillion and represented roughly 59% of GDP. GDP was $9.926 trillion. We are restating for shock and awe – for EMPHASIS. So since the turn of the century, we’ve added $13.341 trillion in DEBT and that has only resulted in $8.295 trillion in ‘GROWTH’. Put another way, we have paid $1.61 in debt for every $1.00 in growth. And don’t forget we are talking about non-GAAP numbers here; it is actually much, much worse. There is no need to perform any kind of adjustment here. It doesn’t really matter how much worse the situation really is because even the biggest simpleton can clearly see how ridiculously nonsensical it is to say the USEconomy is anything but sick and/or dying.
What is also not taken into account is that the $19.921 trillion in national debt that Washington admits to owing needs to be repaid. There are quislings out there who will say that much of the debt ‘doesn’t count’ because we borrowed it from ourselves. What they are referring to is what are known as ‘intergovernmental borrowings’. It is when Social Security taps the General Fund because it is coming up short. Or when MediScare starts a tab at USDA for the same reason. Just because we ‘owe it to ourselves’ doesn’t make it go away, especially considering that we lack the means and ability to pay it back at all. So the programs that got robbed to make up for a shortfall will remain robbed. Or you’ll be robbed to make the robbed programs whole. Are you starting to see where your retirement savings might enter into this picture?
So, again, we look at all of the data and ask the question – where is all the growth? We know where it is coming from – it is being funded by debt. Clowns like Mike Norman will say that this is all ok because when the government borrows money, we get rich as a result because of accounting debits and credits. However, Mike and his deluded bunch of sycophants fail to use the other set of accounting debits and credits that yank the borrowed money back out of the economy (with interest) when it is paid back. They think we can cycle the debt from 2-30 year bonds and back forever and maybe they’re right. But not forever. The establishment has already done a fine job of getting most chaps in the US to believe that there is nothing to see; that everything is ok merely because the establishment has been able to keep things going longer than a bunch of fools looking to make money on newsletters said they’d be able to. While that may be the case, prop jobs are only as good as the prop and a good con job is only as good as the one who is doing the conning. Is it any wonder billions of FRNs are spent every year on fancy TV shows, etc. to maintain the illusion that the emperor still has clothes?
The latest from the mainstream press is that GDP growth in Q1 was increased from .5% annualized to .8% annualized this week. Less than a full percent growth a year? The only rate lower than that is the interest you can expect on a savings account. But you’re expected to clap like little seals because a stuffed shirt from some such agency said the economy has reached ‘escape velocity’. Nonsense.
Some other Debt Updates – and the Grand Conclusion
We haven’t heard boo about the housing market in some great while, have we? Everything has been pronounced to be fine. I guess, according to what you’ve seen above, as long as the credit flows like milk and honey, everything truly is fine. Here are some interesting tidbits though:

Anyone see the makings of another bubble here with HELOCs? Home equity is no doubt a huge piece of the engine of consumer spending once again. People spend HELOC money on a vast array of goods and services – all of which count as GDP. Notice also in the blue series on the right how HELOC balances bottomed out around exactly the same time as the ‘great retrenchment’ in consumer credit – namely the end of 2009 through the beginning of 2011. Since then the party has been on once again. IF the job market was really as strong as everyone says it is, would people still be borrowing like crazy and leveraging their homes? The HELOC bubble forecasted a nasty recession the last time around; is it telling us that we’re in for another beating?
For the finale…

In addition to the almost $20 trillion the government owes various banks, governments, and individuals, the American people owe almost an additional $12 trillion – mostly to banks. The above chart does the best job of breaking down the various types of debt illustratively although we’d quickly find fault with the notion that the consumer is less in hock now than before. However, there is one segment of this chart we’d like everyone to focus on. Look at the maroon series – student loans. Go back to 2003, then look at 2015 and note that student loan debt outstanding has risen to roughly 5X that of just 12 years prior.
Mesh the above with the absolutely terrible job prospects for students graduating in many fields and ask again: where’s the growth? It’s just not there. For the student loan debt outstanding is not just due to rising college costs; it is due to the overall lack of repayment as well. Why? Because many of these poor kids are waiting tables with Bachelor’s and even Master’s degrees! Yet high school guidance counselors still hammer the party line that college is an absolute necessity like it is some sort of birthright of being an American. There are certainly exceptions, however, college should not be an assumption anymore. It needs to be a carefully weighed decision based on hours of research, and a definitive plan of what one wants to do when college is over and whether there is a market for that particular skill.
We suppose the student loan crisis – and it is a crisis – typifies the entire article. Generations are now being inculcated with debt at younger and younger ages. Why is this important? When you have a system and really a world that is based on debt and the embracing thereof, it is critical to normalize debt at as early an age as possible. We fear the American Dream is being replaced by the American Scheme. The scammers are everyone from stuffed shirt news anchors and circus clown political candidates to the ‘guidance’ counselor in your local high school. Perhaps even beyond debt and growth, it is insanity that has reached ‘escape velocity’.
********
Graham Mehl is a pseudonym. He currently works for a hedge fund and is responsible for economic forecasting and modeling. He has a graduate degree with honors from The Wharton School of the University of Pennsylvania among his educational achievements. Prior to his current position, he served as an economic research associate for a G7 central bank.
Andy Sutton is the former Chief Market Strategist for Sutton & Associates. While no longer involved in the investment community, Andy continues to perform his own research and acts as a freelance writer, publishing occasional ‘My Two Cents’ articles. Andy also maintains a blog called ‘Extemporania’ at http://www.andysutton.com/blog.
share
share
share
share
share
More from Silver Phoenix 500


