Fear The Boom!
 share
share
 share
share
 share
share
 share
share
 share
share
I can’t stress it enough. It’s like one of those things that goes in one ear and out the other, I imagine.
After all, the stock markets continue higher, interest rates and unemployment remain low, business investment is generally occurring even if at a slower rate than usual, real estate prices are booming again, and most importantly, the government keeps telling us that the economy has recovered!
Except, well, there is the Fed, and its actions speak to a different chorus.
Of course, the market does not care about what the Fed thinks about the economy, only what it’ll do next.
Knowing the answer to that question is not linear.
You can’t make forecasts using the “everything being equal” qualification because then they are only academic. In the real world you have to take into account the effects of past policies and other constantly changing factors, which are impossible to foresee; and even if they aren’t then you still have to predict how the Fed might react, which requires understanding how the changing environment affects its outlook.
While forecasting the central bank’s exact decisions may be difficult, however, we can say with some confidence that it will not ‘lead’ the market higher on bond yields. It will try to inform the market about the likelihood of changing policy targets, then the market will make the adjustments in expectation of the changes, and thus the rate hike becomes a non event...especially if it is gradual or doesn’t upset markets.
US treasury yields have all risen 15 to 25 basis points since the end of January.
That’s your first rate hike right there.
What investors want to know is whether the boom will survive a tightening campaign, or exit. The central bank’s true goal is to keep the “boom” going and an insolvent government afloat for as long as it can.
[Price stability, full employment, inflation targeting, etc. -all euphemisms.]
A monumental task it would seem to those who understand the true scope of the problem.
I put together a little analysis for you this week on where we are in the boom-bust cycle, which i get into a little lower, and what it means for your investment strategy.
But first, i hope to shed additional light on what a “boom” is, how it differs from true economic growth, and why it is unsustainable. Foremost is the fact that whatever the Fed is doing it is not creating prosperity.
Why Cheap Money is Hostile to Capital Formation and the Economic Foundation
You can’t “create” wealth by printing money; you can’t stimulate growth by suppressing the rate of interest; and you certainly can’t stimulate growth by encouraging more final goods consumption at the expense of saving and adding to the existing pool of wealth. What they are calling growth is really just a binge in consumption for its own sake funded not by additional saving but by schemes that undermine capital.
It is that last part that is the crux of the socio-economic evil… i.e., what most investors don’t understand.
Sure, asset prices go up. Why wouldn’t they. They are denominated in the price of a medium debased rather freely. But when the central bank buys bonds in the open market with freshly created “money” it is ensuring that Wall Street gets it before Main Street: so it can use it before it falls in value and to raise the value of its own assets before others buy them with the money later -once it is debased- at higher prices.
This distributive power of the banking monopoly to print money is sometimes known as a Cantillon effect, named after the biographer and author of an historic account of the Mississippi Bubble, and its causes.
The producers of true wealth (and potential savers) also lose at the hands of the inflation policy because their wealth represents the savings for which the fractional reserve banks end up issuing duplicate receipts - the resources whose use is being diverted to those who are in the front of the line on those receipts. As a result, it will encourage a “diversion of wealth from wealth generating activities to non-wealth generating activities.” This alone should be enough information to help you see the damaging results of the policy.
In its essence, it’s simple once you get it; the misdirection of given (scarce) productive factors and the concomitant imbalance between investment and saving (specifically the shortfall of real saving necessary to fund the investment) brought about by the interest rate suppression in the name of various economic goals - whether those goals are “full employment, price stability, stimulus” or to support “the community reinvestment act”, to fight “deflation”, or whatever - is the primary and most unappreciated cause of business cycles and financial crises. The ends are unimportant to the problem at hand. The problem is economic in nature, as it involves scarce means. And you can’t pretend away scarcity by issuing decrees.
But even if the end was justified or rational, the record of the bureaucracy’s ability to achieve it has to be in question given its record of absolute miserable failure, as Dr. Mark Thornton writes in his latest book - in which he questions also whether the Fed is as transparent as people think just because it opens its books.
In the final analysis, the boom in the money prices of certain assets, which the policy brings about, is not just unsustainable, ephemeral, and redistributive, but also, it is the opposite of economic growth.
It taxes growth by imposing on the economy an unnecessary series of fits and starts, diverting investment to wasteful activity, encouraging unhealthy risk-taking and imprudent judgments (i.e., momentum investing instead of value investing), discouraging saving outright, and by otherwise falsifying economic calculation.
These things hamper the economy’s productivity and long run progress. They are a “hidden” tax.
Therefore, instead of capital accumulation, the hallmark of prosperity and growth, we get capital decumulation; instead of capital formation we get capital consumption or waste; instead of more savings we discourage and deplete the existing pool. That is, the boom, the unsound kind that is deliberately produced by interest rate suppression, is hostile to the processes of actual and sustainable growth. Or, in other words, all the bad stuff that people associate with recessions and downturns happens during the boom.
Cycles, Cycles, Cycles -and their Human Cause
The Keynesians and other central planners would have you believe that investment is not restrained by real actual (voluntary) savings. Indeed, they can do almost anything if you give them a printing press!
As a matter of fact, central bankers believe we have a glut of savings today, which they now strive to control - evidently in order to prevent systemic instability - heaven forbid people decide to invest as they please.
But, they are making the inference of a glut from superficial factors, like when a dog chases his own tail.
The irony of course is that central bank interventions in money and interest are not only the source of the illusion of a savings glut, but also, of instability in the financial system, and hence, of economic cycles.
For the planners, the cycles are determined by geist, or the animal spirits, or some other metaphysical explanation of their historical existence. They are only there to offset it. For the Marxists, capitalism is inherently unstable. None of them think of blaming the planners and interventionists for the instability.
Schumpeter came close to developing a theory of the human cause of economic cycles as innovation, only he could not explain why technological advance occurred in waves - i.e., why the innovations clustered.
Although he is an austrian school economist, his peer, Ludwig von Mises, had not yet finished his treatise on money and credit, and it was not yet widely understood that bank credit expansion (by a central bank supported fractional reserve system) was an extra market disruption resulting in a cluster of errors.
But it was also because Schumpeter did not understand the relationship between saving and investment, and hence did not perceive the imbalance that would arise from an artificial suppression of interest rates.
He assumed that bank credit expansion was a natural free market phenomenon, and thus adopted the generally accepted explanation for business cycles in Marx and Malthus -i.e., that, effectively, free market capitalism is inherently unstable and subject to business depressions, liquidity traps, or savings gluts.
It wasn’t until later (in the seventies) when F.A. Hayek won a nobel prize for the exposition of Mises’s theory of the business cycle as it had developed by the Austrian School without a much overrated Schumpeter.
The foundation of this type of boom - i.e., one driven by money printing rather than saving - is unsound right off the bat. It’s fraud. Whether it is a fraud or not technically in legal terms is up for debate. I’ve heard good arguments for both sides. But in economic terms it is akin to a fraud about how much savings exist.
Since they are fractional reserve in character the expansion of bank credit expands the money supply, quite independently of saving trends, which is akin to issuing duplicate receipts on the existing pool of savings.
The planners call this process “forced savings”, and like real savings, they cause interest rates to fall when injected into the loan market. But unlike real savings, the actual resources aren’t there to fund investment.
That is what leads to the cluster of errors made by entrepreneurs during the boom. It’s a bad signal.
The money creation adds nothing, but only distorts the framework for entrepreneurial calculation.
Since the saving isn’t real, the investments upstream in higher order capital can never be finished - the requisite factors were never freed from use at the opposite end of the capital structure serving consumers.
Either the extra money causes price inflation and changes the valuation proposition mid stride or the policy is abandoned out of fear of this result - either way the investment boom is exposed for what it is.
Is There Any Economic Growth At All?
All this is not to say there aren’t good things happening over the past seven years while the Fed has inflated financial assets and obscured the failure of its government to manage its books. In fact we see a lot of good things happening around us all the time wherever the bureaucracy has not yet erected too many obstacles to entrepreneurship or innovation, and where savings remain in good hands. But it is despite the Fed, and it always could have been more; the true costs are always unseen during the boom phase.
Interest Rate Targeting Is Just Another Form of Price Control
Interest rate suppression is to capital formation what rent controls are to the supply of quality rental apartments or what minimum wage is to full employment (or to labor itself). They are price controls.
Such interventions always diminish the very thing they are evidently aimed at boosting.
The reason is obvious - there is no rational calculation outside of the price system and the profit/loss test, and markets are unable to clear without flexible prices or feedback either from the competition or from the customer, neither of which is possible when government decrees economic relationships unilaterally.
The central bank policy that aims to suppress interest rates in order to stimulate business, investment, jobs and growth instead diminishes the capital foundation (structure) of an economy and its ability to support or sustain all of those things on its own. It creates the illusion of prosperity by boosting consumption at the expense of saving - i.e., the foundation of sustainable investment - and destroys capital by misdirecting investment and falsifying the calculation of profitable activities. “The economy” really can’t take much more of this easy money policy! It is a tax on growth. If there is growth occurring it is occurring in spite of these heavy burdens, and thanks mainly to the human spirit and the capital accumulation of previous decades.
Where Are We in the Current Boom-Bust Cycle??

I will have more to say on current money conditions lower but let me put out a graph here of the year over year growth rate in our measure of money supply so that you can compare it to the record of GDP above.
There is no mystery here; no geist acting upon this data. The content of the money growth statistic above is determined by the Fed’s bureaucracy. It is controlled by humans, and causes the cycle in GDP above it.
Some Important Observations,
Feel free to study the data. Notice that the peaks and troughs in the above series typically precede those in the GDP series. The effectiveness of this monetary causal factor, with regard to lowering interest rates and creating the boom, relies not merely on the growth of money supply, but also, relative to expectations.
Therefore, a growth rate in money that rises unexpectedly fast may go further for central bankers than one that has been telegraphed for a while (that’s likely why the ECB had to double the quantity of QE originally expected from it, and it is why the Fed is constantly trying to manage your expectations -transparently!); likewise, the faster that money growth declines, relative to expectations, the more likely the boom will end.
You can see above that the recessions of 1960, 1970, 1975, 1980-82, 1991, 2001-02, and 2008 were all preceded by a downturn in our money growth statistic -including two false signals (1985 & 1994), although there was turbulence in the 1994 year with US government bond values getting creamed, i remember.
You would be hard pressed to find a single stock market accident or financial crisis in the historical record worth noting that was not preceded by a noticeable decline in money growth. It’s all about the money!
As an aside, notice also how the growth rate generally slopes upward from the nineties onward. The last time it dipped below zero was two decades ago. I believe this supports my thesis that what has changed is they can no longer afford such a sharp contraction in money growth, or its corollary, normal interest rates.
But that should be plain as day from the sheer fact that we are so many years in on ZIRP.
In the data above, depending on how you categorize it, I count about seven distinct cycles from trough to peak, or seven peaks and seven troughs. That means the troughs and peaks are separated by about 7-8 years on average. And we know that equity boom sequences typically last 3-6 years in various sectors.
This record, and other data, would suggest that the US boom is overdue, and at worst in recession already.
The ECB Monkey Wrench
Although there are faint signs here or there, the meat of the sovereign debt crisis has not yet revealed itself, and i can’t help wonder whether the ECB’s QE intervention has head it off or whether it is too little too late.
On the one hand, there is no shortage of bad omens: Russia, Greece, the oil sector, Yemen, weakness in the Canadian bank stocks, anemic GDP and profit growth in the US, manufacturing weakness, etc. On the other hand, the ECB program is bigger than expected and US money growth still coming in respectably.
In my model, a decline in the above money supply statistic to the shaded region - or below 5 percent - is one of three triggers that produce a bear market signal in stock prices (in the U.S. and Canada). The other two include valuation and sentiment, both of which have been screaming sell signals for over a year now.
[I consider profit growth and the charts as secondary or derivative to those three categories - profit growth, which has begun to sputter, is absolutely derived from money growth, and technicals help with timing.]
While I have not gotten a pure sell signal out of my US money growth statistic, there are a few factors that persuaded me the slowdown from an above average high of around 16% year over year in the middle of 2011 to 7.5% year over year (in our austrian measure) in 2014, as the Fed halted QE, had already started the bust. One of these factors was that monetary contributions from Europe and Japan were overstated in 2014 (and I still believe that the BOJ is sterilizing). Another is the withdrawal of the Swiss from the alliance. Finally, I happen to think, the fact that this is one of the most centrally contrived booms ever (i.e., that the Fed did most of the work in money creation this time around compared to the banks -i.e., the chart here basically tells us the extent to which the Fed has monetized the deposit liabilities of the US banking system) makes a difference to the durability of the boom. I think it’s more vulnerable to a Fed tightening than usual.
Lining Up the Dead Canaries
Perhaps a look at some economic data might help.
Recall the GDP graph above. The latest numbers have settled on a year over year growth rate of about 2.4% in the fourth quarter of 2014, which compares to a historical average of 3.2% going back to 1948.
Another interesting trend is that this boom has petered out at a lower growth rate than the last, and the last one petered out at a lower growth rate than that of the nineties, and so on - you can see a general decline in the annual growth rate of this statistic. It is not helped by the new changes to its calculation or by the fact that half of the existing global dollar supply was created after 2008. Even by their own standards this is the most anemic periods of growth on record. But we already know that, given the fear of the Fed to exit ZIRP.
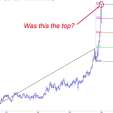
What about profits,
Is that a double top there? Could it be a harbinger of what oil is telling us and the decline in money growth over the past few years, ever so gradual as it’s been -but also somewhat unsupported by its foreign allies.
Note in the table and charts below (revealing percentage growth rates) that S&P profits are below their historic averages again in 2014 despite a small uptick compared to 2013, and they are down in Q4 over Q3.
Also observe that they are expected to grow in the single digits this year, and less than 15% in 2016 -and take into account that expectations have always started out high and dropped as the date of reporting approaches. These kinds of growth rates can’t support a stock market trading at 20 times trailing earnings.
|
S&P 500 Earnings Trends ** |
Last |
Annualized Growth Rates |
Total |
Forward Growth |
|||
|
Category |
Q4 |
2014 |
5yr Avg |
10yr Avg |
2008-now |
2015 (e) |
2016 (e) |
|
S&P 500 Operating EPS |
$113.04 |
5.3% |
14.7% |
5.3% |
163% |
4.6% |
14.2% |
|
S&P 500 Operating EPS (gold-adjusted*) |
0.10 |
6.5% |
13.1% |
-4.7% |
122% |
|
|
|
S&P 500 GAAP eps |
$102.29 |
2.1% |
14.9% |
5.7% |
1391% |
8.0% |
11.6% |
|
S&P 500 GAAP eps (gold-adjusted*) |
0.09 |
3.2% |
13.3% |
-4.3% |
1160% |
|
|
|
S&P 500 Dividend Yield |
2.0% |
2.9% |
-0.4% |
2.1% |
-42% |
|
|
|
S&P 500 Dividends /share |
$39.44 |
12.7% |
12.0% |
7.3% |
45% |
|
|
|
S&P 500 PE Ratio |
17.7 |
4.0% |
-2.0% |
-0.1% |
-5% |
|
|
|
S&P 500 ERP |
3.1 |
24.8% |
12.2% |
7.2% |
95% |
|
|
|
S&P 500 Expected Yield (div + earn) |
7.1% |
-4.3% |
1.5% |
1.0% |
66% |
|
|
|
10-yr T Note Yield TCM |
2.3% |
-23.3% |
-9.6% |
-5.8% |
-15% |
|
|
|
S&P 500 Index |
2000 |
9.6% |
12.4% |
5.1% |
151% |
|
|
|
USD Gold Price |
1183 |
-1.1% |
1.5% |
10.4% |
18% |
|
|
|
* adjusted for gold prices (# oz a unit of S&P earnings can buy) |
|||||||
|
** earnings and dividend data are for trailing 12 months |
Another way to look at this data is in terms of a chart of the year over year growth rate statistic (below), which shows significant slowdown in profit growth post 2011 and in real terms over the past few months.
The second part of the graph below depicts S&P500 profits measured in terms of gold ounces.
Finally, two of Wall Street’s favorite leading indicators,
Uh-oh!
None of that looks good for investors buying stocks!
It doesn’t look to me like a 2006-08 redux is likely (that’s where the ECB helped extend the last boom).
If the ECB is able to keep bond yields down and extend the boom, if the US banks can continue to support money growth in the Fed’s absence, and if i am wrong about the Bank of Japan’s strategy, it is possible for a repeat of the 2006-08 situation where we’ll see a revival of the commodity complex with gold bringing up the rear. If the ECB is too late and a bust unfolds then we would expect an over reaction from the Fed (i.e., QE4), which, ironically, might work against gold in the second inning ‘if’ it gives financial values a lift. Gold, imo, would rally hard in the first inning in response to a stock market roll over, so this pullback would likely nevertheless occur from higher levels. Moreover, it would not sit out too many innings. The Fed’s ideology has reached a dangerous stage where all of its efforts are going to bring about a revolution in price inflation.
At any rate, the short term question is to bust or not to bust -has the ECB saved the day?
|
March 16, 2015 |
M/M $ |
MO % |
QTR % |
YOY $ |
YOY % |
|
Money Supply, Austrian |
$31 |
3.4% |
9.0% |
$759 |
7.5% |
|
|
|
|
|
|
|
|
Major Components |
M/M $ |
MO % |
QTR % |
YOY $ |
YOY % |
|
Currency |
$7 |
6.2% |
8.3% |
$88 |
7.4% |
|
Demand Deposits |
-$25 |
-25.0% |
7.6% |
$110 |
10.2% |
|
Other Checkable Deposits |
$5 |
11.4% |
15.5% |
$31 |
6.4% |
|
Total Savings Deposits |
$45 |
7.0% |
9.0% |
$520 |
7.2% |
|
|
|
|
|
|
|
|
Base Money |
M/M $ |
MO % |
QTR % |
YOY $ |
YOY % |
|
Total Reserves |
$235 |
110.3% |
18.8% |
$114 |
4.3% |
|
Required Reserves |
-$6 |
-48.3% |
1.0% |
$10 |
7.7% |
|
Monetary Base |
$250 |
78.2% |
15.9% |
$205 |
5.3% |
Reverse Mania Update
Seven years of zero interest rates, the longest such stretch of cheap money in Fed history, producing in turn one of the longest unsound “booms” in US history (one of the longest periods of economic abuse in its history) - and confidence in gold is at an all time low! The stock market is not that expensive relative to interest rates but those rates are not real. It is expensive in every other way, particularly relative to the growth in profits.
The Fed’s policy has punished value investors as well as savers, and continues to backstop imprudent risk takers. Financial asset values have been directly subsidized and supported by central banks worldwide.
The bear market in gold shares is second to only one other in US history.
There is no better time to be a value investor. It has gone too far out of style.
The Point of Desperation and the Coming Weimar Transition
A mentor of mine used to tell me, in collectivist language, that gold’s day would come when Americans have become desperate enough to create a delusion for themselves. I disagreed with him, believing that it would come sooner. He thought, in Y2K, it would still be a decade. I thought it was around the corner.
Turns out, we were both right. His only mistake was not realizing how the transition would play out.
Just like today’s hold outs for better times ahead are going to miss the first rally or two off the bottom, my old mentor missed the first part of the transition to more desperate times. If you ask me, he overlooked this primarily because of the pressures of the industry to cuddle in with the herd for safety during extreme times.
Anyone who promoted the gold story in 1999 or 2000 was literally shunned, ostracized, and/or laughed at.
That is not hyperbole.
My employer begged me to leave because I insisted on trading gold and oil futures and shorting the S&P’s instead of doing tech deals, collecting retirement accounts, or making markets for NASDAQ companies.
Our discussion occurred in 1999, at the dawn of a new bull market in gold brought about by the inevitable transition the Fed made under Greenspan from a Volcker style hawkish governance - with regard to monetary policy - to a dovish backstop, culminating in the tech bubble that gave rise to our argument.
Since then, over the course of about 15 years, gold has run up from around $255 to $1925 (nearly a 700% gain), while the S&P 500 is up 40% excluding dividends, and the pm stocks, which everyone thought died a gruesome death in the nineties, put in about three considerable legs in that time -led by new groups.
And if you owned the tech stocks, which were in fashion with the herd, or the financials or homebuilders in the next bull leg (2003-07), there’s no way you would be ahead today unless you traded out just in time.
Although those weren’t desperate times, yet, we saw respectable gains in that asset class.
Indeed, I had to leave the industry to tell this story because at the time there were very few ways that investors could participate except through the miners and explorers on the VSE, which was disappearing, and ultimately absorbed into the TSX/TMX group in Toronto -a victory for the east in the 100yr old rivalry between the TSE and VSE. It was feared back then that if I was right about gold, we were all screwed.
And yet, nobody was listening to what i was saying, exactly. For I was not yet calling for that moment of desperation leading to crack up. As those who have been reading me know, I have stopped short of a hyperinflation call, but i have laid out a condition under which i would make that call - which was if the Fed lost its private charter and its governance went all the way to congress. They would inflate out of debt!
My current gold forecast: $3-5k is where i expect to see gold during or following a period of stagflation, and we are probably a few years from that yet. But it is coming. However, my former mentor’s expected moment of desperation appears to have preceded it. For what else would we call a situation where we are seven years into the most aggressive cheap money policy the Fed has ever implemented, in order to obscure the reality that governments have become insolvent? In this most tenuous of circumstances for goldilocks, where people have regained confidence in the central bankers abilities to manage the economy, people should be buying gold and silver not worrying about whether it will ever come back. When i look at the market of investors I see a manic depressive today grasping at hope and desperate to believe in the illusion of prosperity. I wouldn’t waste any time taking advantage of the negative sentiment in gold/silver.
In the below graph, the purple line is the gold price. The other lines represent what the gold price would be if it were adjusted for increases in mine output and if it kept up with money supply growth in the US from various base years. Clearly, it is ahead of the postwar inflation but it is running behind its long term (1913 - red line) money supply growth rate and has been running behind its post 1981 money supply growth rate.
In my model, I am a buyer below the red line, and a seller at or above the blue line -it’s coming!
Over the next two years I expect a steady grind up to $2k followed by a spike to the blue line plus or minus.
You will not see the same gain occur in any of the other major asset classes in this time frame, whether it starts now or in six months. Financial assets in North America have largely had their day. It’s our turn.
[P.S. I forgot to label it but the above is my shadow gold price indicator]
Investment Strategy
So what do we do. Our recommendation hasn’t changed much over the years except we’ve long put the initial cash portion of our hypothetical allocation to work in gold stocks...a bit sooner than we should have.
I think the basic asset classes that qualify as hedges against the inflationary policies of the central banks are equity, real estate, and precious metals. You could include bonds with equity and call it financial assets if you like, but I flat out don’t like bonds, not at these levels. Same with cash here. I don’t like equity either - in the short term - but i still like equity over government obligations as a general hedge against inflation.
If you asked us in 2008 or 2009 my answer was buy everything including US dollars.
Today, I’m bearish on both US equities and the US dollar, just as I was in 1999-2000, except this time I’m also bearish on Treasuries. Also, this time, I’m on the fence about foreign equities. Will the ECB policy light them on fire like the Fed’s QE3 lit US equities up? That could happen at the same time that dollar assets sell off. Maybe the specter of sovereign debt problems shifts over to America as yields soar?
Deflation is nowhere a possibility in my mind, unlike a deflation scare or a demand shock (or bust).
When I say deflation I mean the debt-deflation spiral that Fisher invented to justify central banking, and that could only occur if we came to our senses and abandoned the central bank.
Being an unapologetic value investor, i have to continue to recommend a variation of the following allocation: precious metals, gold, silver and uranium miners, exploration juniors, bitcoin, short against US financial assets. Real estate is a bit of a staple but i really think it is expensive here in most places around the world, particularly in Canada, the UK, etc. Honestly, some of the best ways to grow your wealth is to invest it in local businesses and entrepreneurs. But diversification is important for wealth preservation.
The more places you have your wealth the better.
Ideally, my allocation for your financial (non real estate) wealth would be as follows today,
|
RECOMMENDED INVESTMENT STRATEGY |
|
|
|
ASSET CLASS / SECTOR |
PROXIES / EXAMPES |
ALLOCATION |
|
Precious Metals (Au, Ag, Pt) |
CEF, GLD, PHYS |
30% |
|
PM Growth Portfolio (equity) |
35% |
|
|
Uranium Shares (equity) |
URA |
10% |
|
Bitcoin |
n/a |
5% |
|
Short: US equities |
QID, DOG, SH (subscribe) |
10% |
|
Short: 10-yr UST |
TBT |
10% |
|
|
|
|
You could say we are 35% net long equities (35 + 10 - 10) but if you count gold equities as counter cyclical then we are 35% net short equities. I don’t typically view the miners as countercyclical because they go with the market often times as well, though this time they are definitely set to go countertrend.
I have a very overweight position in gold equities matching the extremity of the value proposition as i see it, given my $3-5k gold price target area over the next 2-3 years. I recommend treating them differently than your precious metals holdings. They are a business and present cyclical or growth opportunities rather than ways to preserve wealth -which over the longer term would be better suited to industrial stocks also.
All of that depends on valuation at any given moment.
I would not stop a client from raising the allocation on bullion up to 50% if they were able to diversify those holdings internationally - see our Get Your Gold Out Of Dodge report - while reducing the gold stock portion accordingly, or limiting your exposure to both at 50% combined, as long as you follow the general spirit of our strategy.
In this case you might want to increase your short allocation a little or maybe not; maybe there are other sectors outside of the resource area where there is value on the long side, like in oil and energy -though maybe early. There could be others. But for heaven’s sake don’t chase the crowd this late in the cycle.
The risk of that strategy is very high at any rate; better to be in cash if you don’t want to be in gold.
Premium subscribers will get an update on the gold stock portfolio soon, but keep in mind that 75% of the allocation in that portfolio goes to diversified going concerns - actual miners - and not exploration juniors.
There is a reason for this.
Even though I agree that there are huge bargains among the rubble in the junior space I think the first wave of fresh money is going to chase the segment that is most sensitive to the gold price in the short term, and which can be treated as a safe haven class while the broader equity sector and bond markets are plunging.
As a segment, the juniors are going to be quiet for another year or two, but the miners will be rallying.
Moreover, that’s not to say there won’t be opportunities among the juniors.
In fact, we are seeing many and will continue to try to pick the best for our premium growth portfolio.
I’m putting together a list of TSXV listed companies with a gold resource trading below $20 per ounce as a starting point. Of course, at that deep end, the vast majority will be throw aways. But we will find the gems!
Stay tuned. The times are just getting interesting.
********
Courtesy of www.dollarvigilante.com
share
share
share
share
share
 Ed Bugos is a mining analyst, investment banking professional, and senior analyst at The Dollar Vigilante (an online guide to surviving the dollar crash), with more than 20 years experience in the investment business advising clients on portfolio and trading strategies.
More from Silver Phoenix 500