The Great Silver Bubble
 share
share
 share
share
 share
share
 share
share
 share
share
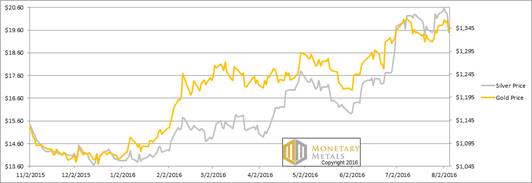
The price of gold was down about fifteen Federal Reserve Notes this week. The price of silver was down sixty-two copper-plated zinc pennies. Is the Federal Reserve Note a suitable instrument with which to measure gold? Can one really use debased pennies—which aren’t even made of the base metal copper any more—to measure the value of gold? We don’t know. We just work here. Quick, buy some silver, we hear it’s going to $100!
Not so fast. As the headline suggests, we think silver has been bid into a speculative bubble. We’ll cover that and show a new graph to support our discussion.
Read on for the only the only true picture of the supply and demand fundamentals for gold and silver. But first, here’s the graph of the metals’ prices.
The Prices of Gold and Silver
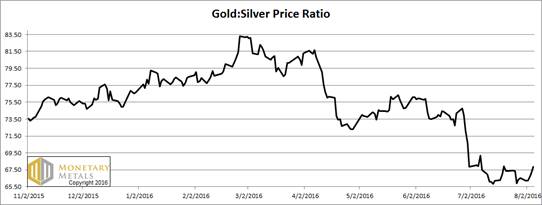
Next, this is a graph of the gold price measured in silver, otherwise known as the gold to silver ratio. The ratio rose this week.
The Ratio of the Gold Price to the Silver Price
For each metal, we will look at a graph of the basis and cobasis overlaid with the price of the dollar in terms of the respective metal. It will make it easier to provide brief commentary. The dollar will be represented in green, the basis in blue and cobasis in red.
Here is the gold graph.
The Gold Basis and Cobasis and the Dollar Price
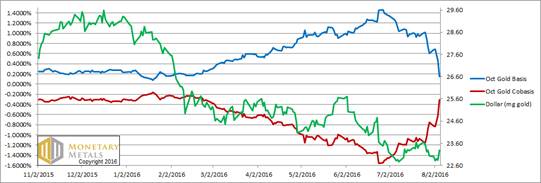
A little move down in the FRN-price of gold, i.e. a ¼ milligram move up in the price of the dollar as measured in gold… and we see larger moves in the basis and cobasis. The abundance of gold fell, and its scarcity increased.
The market price may have dropped, but our calculated fundamental price bumped up. It’s still below the market price, but not all that much.
Silver is another story, so let’s turn to silver.
The Silver Basis and Cobasis and the Dollar Price
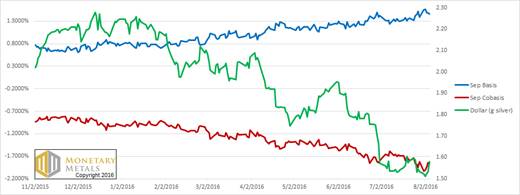
Note: we switched from the September contract to December as September is too close to expiry to be usable as a signal now.
The price of silver fell more than gold in proportion, but we do not see anything like the move in its bases. Unsurprisingly, the fundamental price of silver fell. It’s way, way under the market price.
Consider the following graph.
The Great Silver Bubble
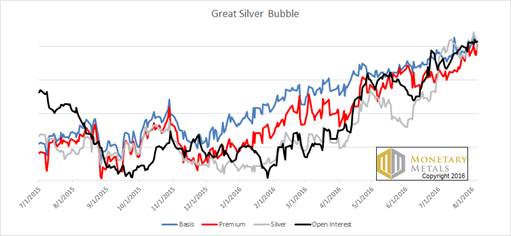
This is a picture of the price of silver, along with the basis, premium (the market price – our fundamental price, shown as a percentage), and open interest in the futures market. As we have written in the past, open interest tends to rise as the basis rises, because a higher basis is a greater incentive to carry silver. To carry metal, you simultaneously buy a bar and sell a contract. You are not betting on price, but earning a small spread—the basis spread.
The basis and our calculated premium bottomed and began their current rise around late November. The price of silver began moving up a bit later, around mid-January. And open interest bottomed in late January (it is subject to other factors, such as bank credit availability). Since then, a great bubble has been inflating, with a small leak in May.
The correlation of these four numbers—price, basis, premium, and futures open interest—is not perfect, but it’s uncannily close.
Who knows when the air will be let out of it? All we can say is that Friday’s 61-cent price action is likely a small down payment on a $3 move south.
© 2016 Monetary Metals
share
share
share
share
share
 Dr. Keith Weiner is the CEO of Monetary Metals and the president of the Gold Standard Institute USA. Keith is a leading authority in the areas of gold, money, and credit and has made important contributions to the development of trading techniques founded upon the analysis of bid-ask spreads. Keith is a sought after speaker and regularly writes on economics. He is an Objectivist, and has his PhD from the New Austrian School of Economics. His website is www.monetary-metals.com.
More from Silver Phoenix 500


