Is July 5th The Next Stock Market Bottom?
 share
share
 share
share
 share
share
 share
share
 share
share
The chart below shows a repeating pattern of 115 trading day tops on the S&P 500 virtually shadowing the 100 trading day cycle to cycle lows. The 100 TD lows can run anywhere between 85 and 115 trading days. This low is commonly referred to as the 20-week low. The 20-week low is half of the dominant 9-month low that usually runs about 40 weeks +/-.
Another useful tool is called the Bradley Siderograph. Also known as the Bradley, this tool uses planetary aspects to time important turns in the stock market. The two most important Bradley turns this year are July 5th and November 29th. Both fall on the new moon. Both also fall on the next two expected bottoms for the stock market in the year 2016 based on the past repeating cycles.
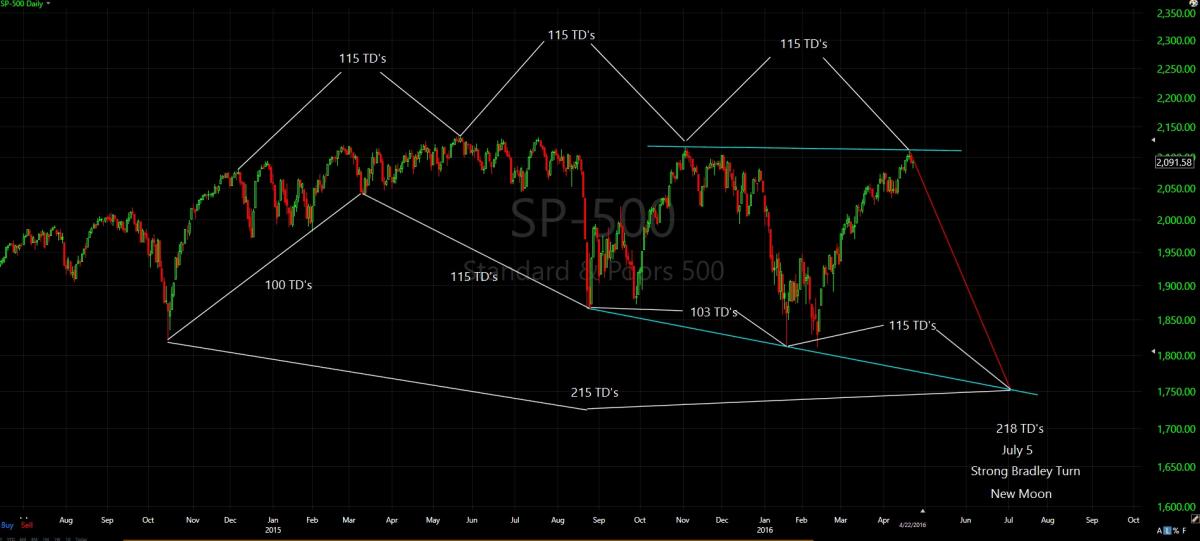
The dominant 9-month cycle occurred in October 2014 then August 2015. It is due in early July 2016, then again in April 2017 +/- one month, which also coincides with the larger 8-year cycle bottom from March 2009.
In the next article, I will be investigating the Elliott Wave Pattern of the gold market along with the "Equality of Waves Principle" and see how it matches the Gann cycles and the Mercury Retrograde effect on the precious metals sector. I will also be touching on TLC (trend line convergence) cycle lows in GDX and how GDX has been running opposite gold as far as the dominant 16 trading day cycles are concerned. I will also be going over the IMP (Irregular Megaphone Pattern) again and the bearish implications for GDX (and gold) for the month of May. Hint: a more important top in gold and GDX is not yet in, but we are close.
********
Brad Gudgeon, editor and author of the BluStar Market Timer, is a market veteran of over 30 years. The subscription website is www.blustarmarkettimer.info
share
share
share
share
share
More from Silver Phoenix 500