More Short-Term Uncertainty Following Economic Data And Earnings Releases
 share
share
 share
share
 share
share
 share
share
 share
share
In our opinion, speculative short positions are favored (with stop-loss at 2,210, and profit target at 2,050, S&P500 index).
Our intraday outlook is bearish, and our short-term outlook is bearish. Our medium-term outlook is neutral, following S&P500 index breakout above last year's all-time high:
Intraday outlook (next 24 hours): bearish
Short-term outlook (next 1-2 weeks): bearish
Medium-term outlook (next 1-3 months): neutral
Long-term outlook (next year): neutral
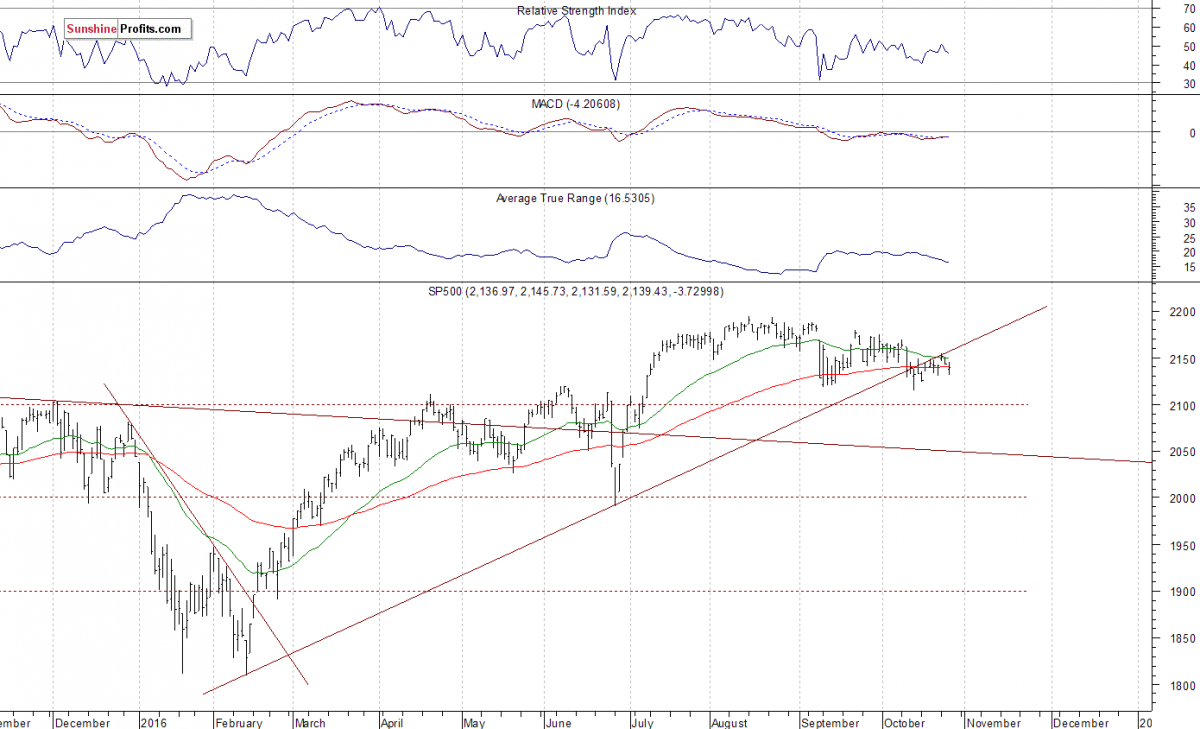
The US stock market indexes were mixed between -0.6% and +0.2% on Wednesday, as investors reacted to worse-than-expected Apple's quarterly earnings, Consumer Confidence number releases, among others. The S&P500 index continues to trade close to its resistance level of 2,150. There has been no clear short-term direction so far. The next resistance level is at 2,170-2,180, marked by some previous local highs. On the other hand, level of support is at 2,130, and the next support level is at 2,115-2,120, marked by previous local lows. The market continues to trade along medium-term upward trend line, as the daily chart shows:
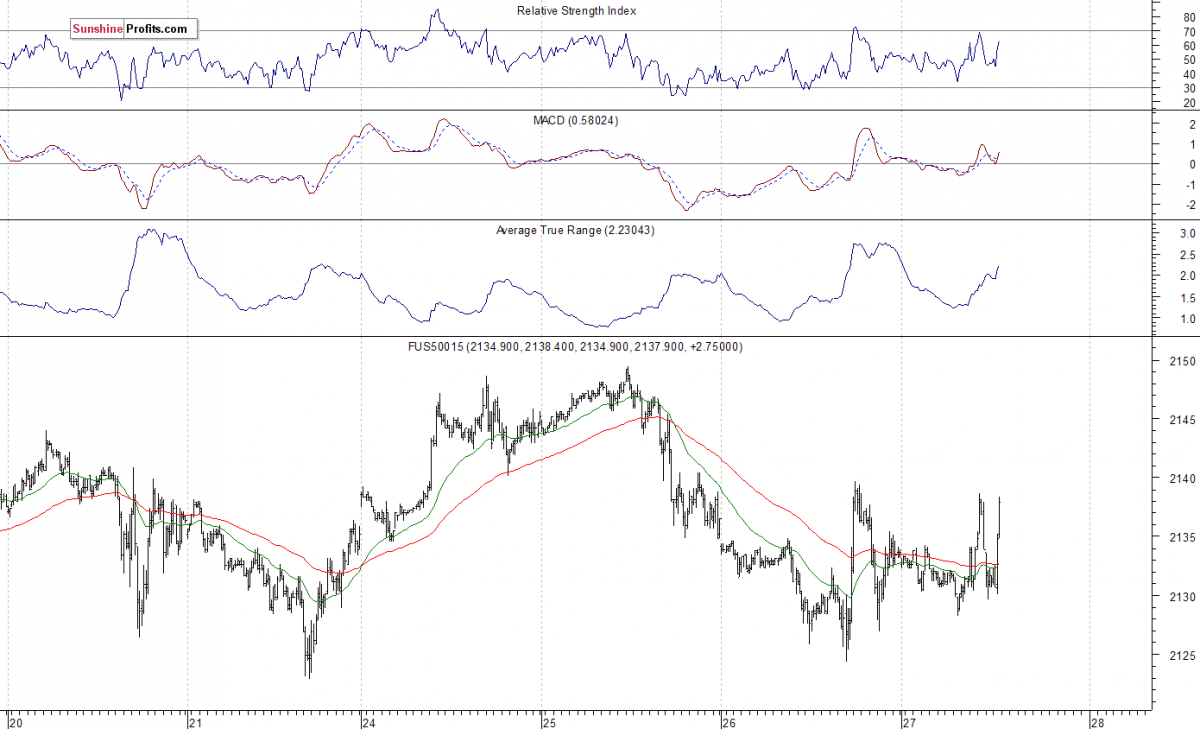
Expectations before the opening of today's trading session are positive, with index futures currently up 0.2%. The main European stock market indexes have been mixed so far. Investors will now wait for some economic data announcements: Initial Claims, Durable Orders at 8:30 a.m., Pending Home Sales number at 10:00 a.m. The S&P500 futures contract trades within an intraday consolidation, as it continues to fluctuate along the level of 2,130. The nearest important level of resistance is at around 2,140-2,150. On the other hand, support level is at 2,120-2,130. For now, it looks like a flat correction within a short-term downtrend:
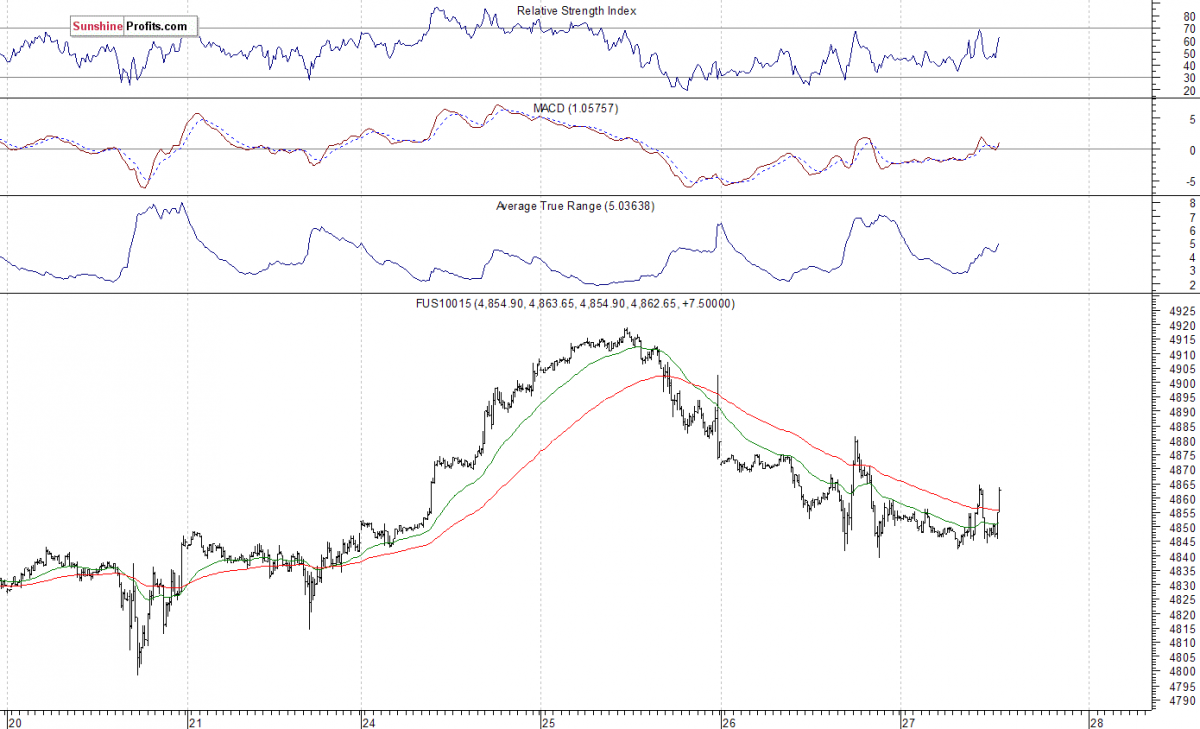
The technology Nasdaq 100 futures contract follows a similar path, as it trades within an intraday consolidation. It fluctuates along the level of 4,850 today. The nearest important resistance level is at 4,880-4,900. On the other hand, support level is at 4,800-4,840, marked by previous consolidation, as we can see on the 15-minute chart:
Concluding, the broad stock market continues to trade within a short-term consolidation, as the S&P500 index remains relatively close to 2,150 mark. For now, it looks like a flat correction within a downtrend. Therefore, we continue to maintain our speculative short position (opened on July 18th at 2,162, S&P500 index). Stop-loss level is at 2,210 and potential profit target is at 2,050 (S&P500 index). You can trade S&P500 index using futures contracts (S&P500 futures contract - SP, E-mini S&P500 futures contract - ES) or an ETF like the SPDR S&P500 ETF - SPY. It is always important to set some exit price level in case some events cause the price to move in the unlikely direction. Having safety measures in place helps limit potential losses while letting the gains grow.
share
share
share
share
share
More from Silver Phoenix 500


