Silver Market Update - Giant Base Pattern Competing...
 share
share
 share
share
 share
share
 share
share
 share
share
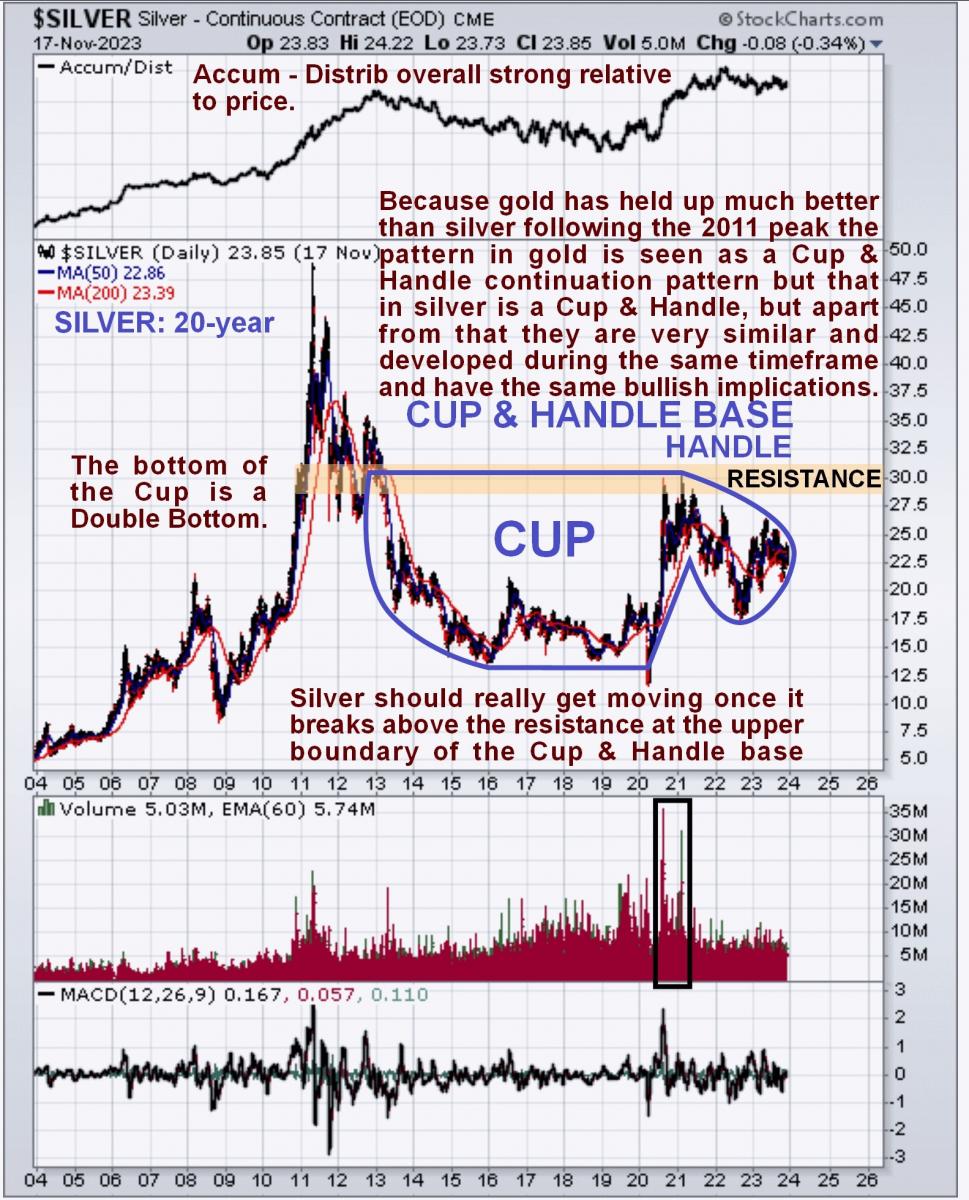
In considering the outlook for silver it is crucial to compare and contrast the long-term charts for silver and gold, since they tend to move in unison. As we saw in the parallel Gold Market update, gold is now very close to breaking out upside from a multi-year consolidation pattern, and so, although silver is still has a ways to go before it can do likewise, if gold breaks out it will “take silver along for the ride”.
There are two key points to observe on the long-term 20-year chart for silver. One is that the huge Cup & Handle base that has formed in it since 2012 – 2013 which is therefore of about 10 years’ duration, parallels the giant Cup & Handle consolidation pattern that has formed in gold over the same period. So if gold breaks out upside then silver will too, but unlike gold which will quickly attain new highs, silver will have a considerable amount of resistance to chew its way through before it can make new highs as it is still a long way below its 2011 highs. This brings us to a related point which is obvious when you compare silver’s long-term chart to gold’s which is that silver has markedly underperformed gold since its 2011 highs. However, this is not something to worry about – on the contrary it is quite strongly bullish, because it is sign of excessive negative sentiment towards the sector of the sort that leads to a major new uptrend developing.
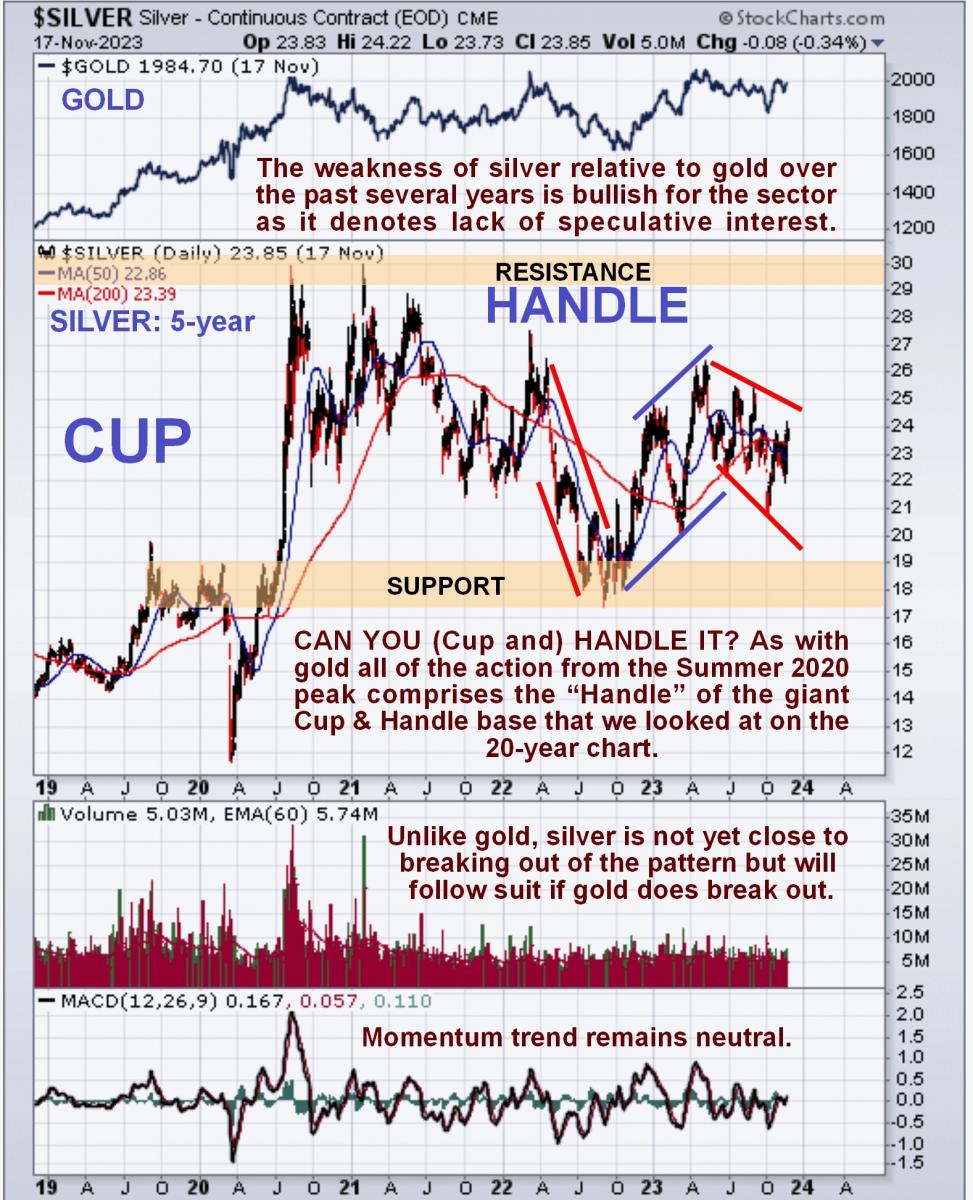
Moving on, the 5-year chart shows the latter part of the Cup and the Handle of the giant Cup & Handle base in much more detail. Basically the price has been meandering around rather aimlessly since the dramatic surge in the middle of 2020 to complete the right side of the Cup, in the process marking out the Handle of the pattern, but without reference to long-term charts you wouldn’t have a clue what was going on. This is essentially a giant slightly downsloping trading range and with the benefit of hindsight we can see that it would have been profitable to trade the larger of the swings within this trading range, in particular the rally off quite strong support from last September’s lows. The main point though, as we can clearly see on the 20-year chart, is that on a proportional basis the Handle of this giant base looks about complete, meaning that we can expect to see an upside breakout soon into a larger uptrend and this accords of course which what we have observed on gold’s long-term charts. Before leaving this chart we should note that silver is quite a long way from breaking out above the resistance marking the upper boundary of the Cup & Handle base which is approaching and at $30, and it has quite a lot of resistance to work its way through on the way up.
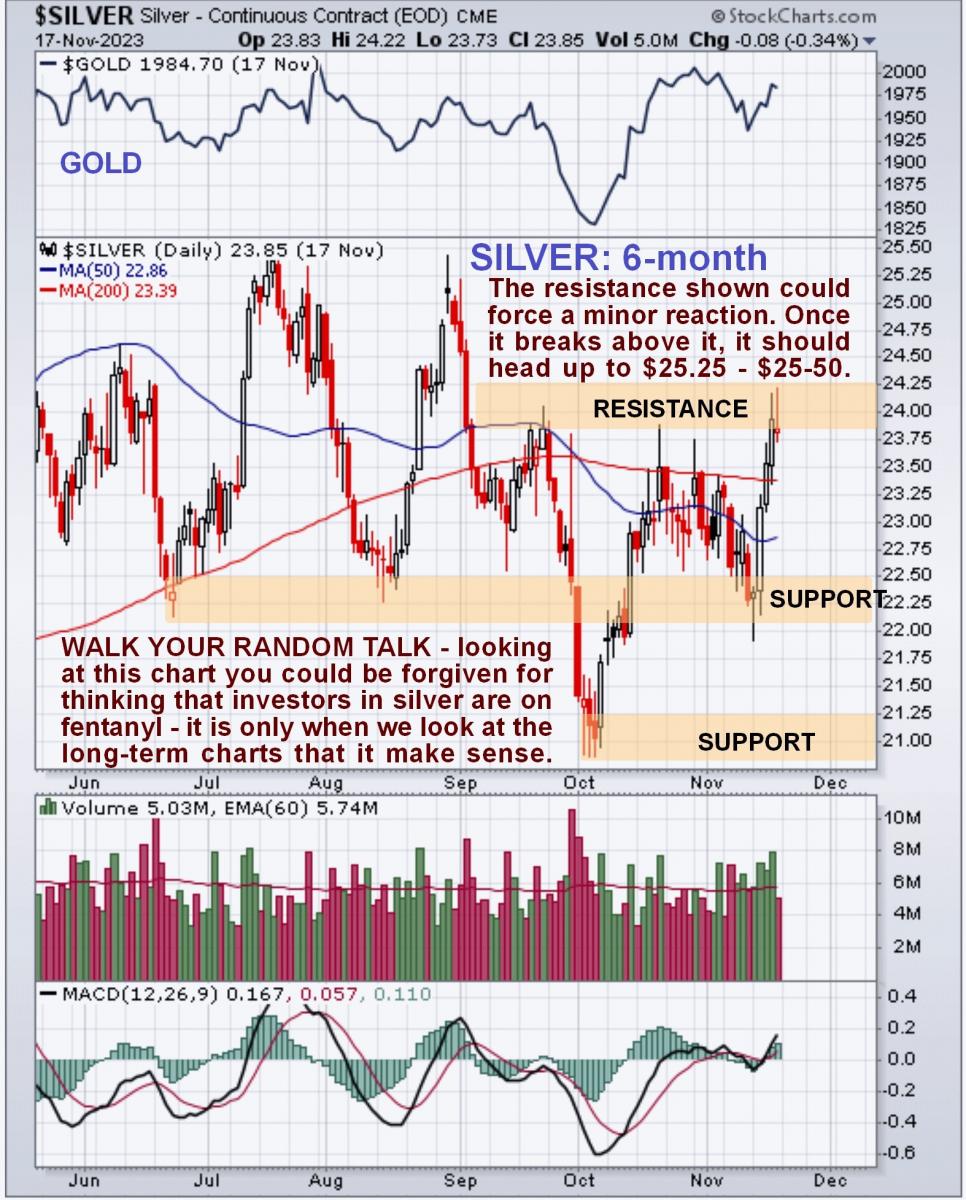
Next, and largely for the sake of completeness since it is vIrtually useless for technical purposes, especially without reference to long-term charts, we will take a brief look at the 6-month chart. This shows the price meandering around in a rather aimless manner. The rally over the past week or so has brought it up to a resistance level that could send it lower again, although it shouldn’t drop by much. Once it breaks above this resistance, the next stop will be the resistance in the $25.25 - $25.50 area.
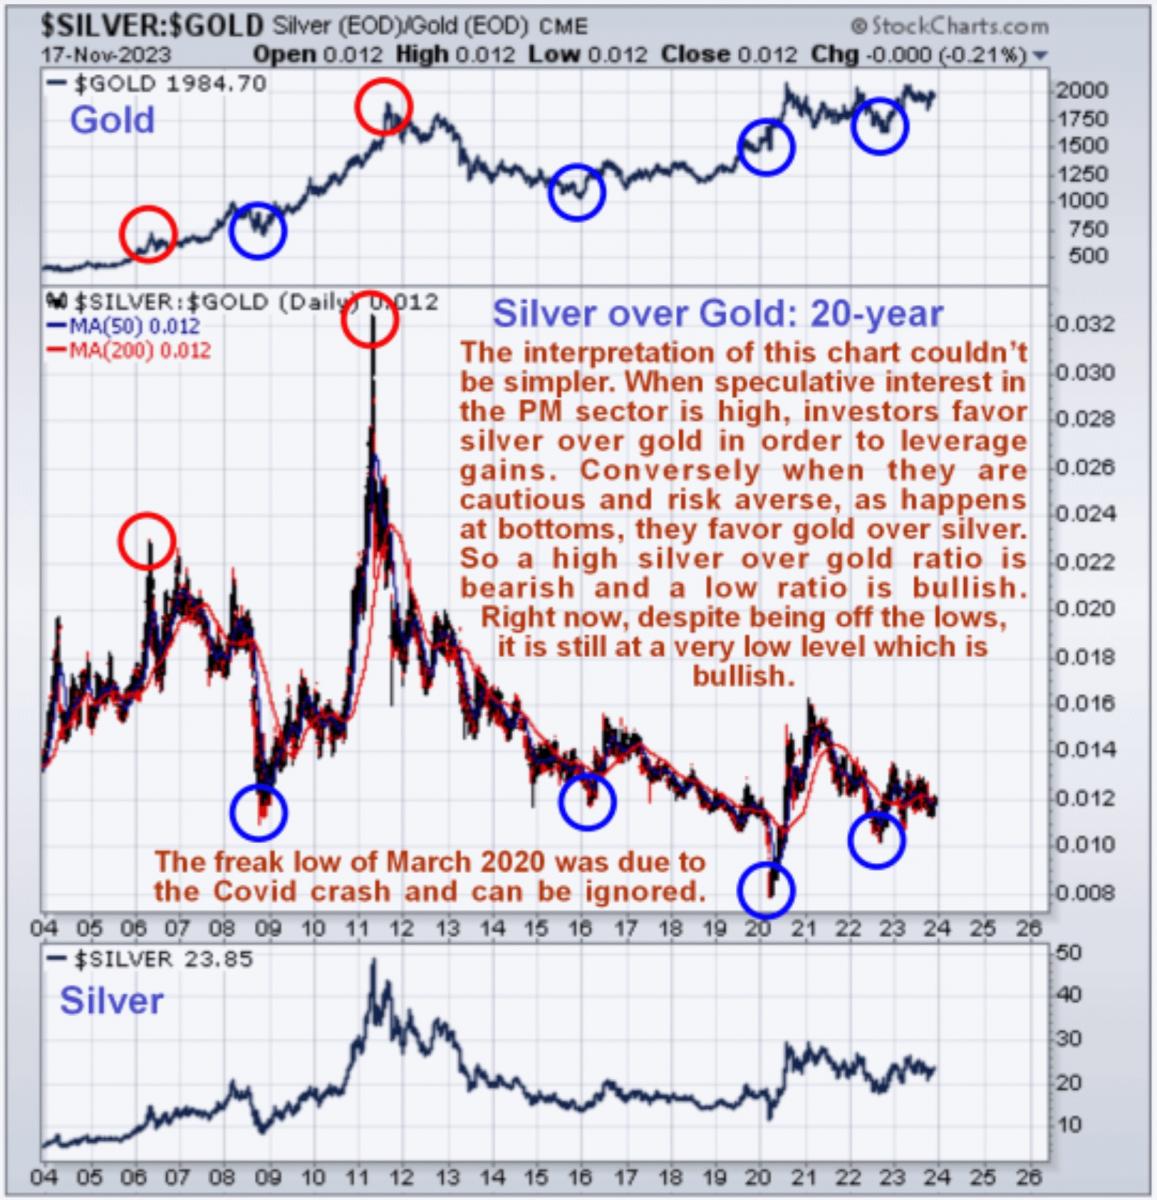
We will end by taking a quick look at the silver to gold ratio – this section is a copy and paste from the Gold Market update for convenience. The long-term 20-year chart for this ratio enables us to see major inflexion points in the past. The rationale behind the interpretation of this chart is simple – when investors are very bullish on the Precious Metals they tend to to favor silver over gold in order to leverage gains, since silver’s swings tend to be bigger than those of gold, so excessive bullish sentiment as shown by a high Reading for this ratio tends to be seen at tops, such as was the case in May of 2011, but when investors are excessively cautious towards the sector, they tend to favor gold over silver, as it is regarded (rightly) as a safer investment. So times of excessive pessimism towards the sector are indicated by low readings of this ratio, such as we are seeing now, even though it is off the lows. The current low readings are thus a fertile environment for the birth of a major new sector bullmarket. Note that the freak Covid Crash lows of March 2020, when orchestrated paranioa was at a peak, can be disregarded.
In closing the main point to keep in mind with reference to silver is to watch for gold breaking above its key $2100 level which should kick off a major uptrend, because if that happens it will take silver with it and although silver has resistance to contend with on the way up it will be emboldened to forge ahead regardless if gold really takes off soon as expected.
********
share
share
share
share
share
More from Silver Phoenix 500


