Silver Price Forecast: Continued Lagging Signals Caution


Silver is acting weaker than it should be this juncture, just over two years after an important bottom in the precious metals complex formed in late 2015.
From the December 2015 lows in both precious metals at $13.65 per ounce for silver and $1,045 for gold, while both have risen, silver prices have underperformed gold. Since the bottom, silver is up 19.8% to close at $16.36 this week, while gold is up 27.8% to close at $1,336 over the same timeframe. Silver is clearly the laggard of the historic monetary metals amidst the present cycle.
What are we to make of this underperformance in silver? Is there still a possibility for silver to match gold’s performance? Or is this a warning sign that the advances in the precious metals since 2015 are suspect?
The best way to view the relationship between the two metals is through the gold to silver ratio. The ratio tells us how many ounces of silver are needed to purchase one ounce of gold. As of the end of the week, the ratio stood at 81.6.
Why is the Gold to Silver Ratio Important?
As a general set of principles:
• A rising gold to silver ratio, when gold is outpacing silver, tends to correspond with falling prices for both metals as investors seek safety in gold.
• A falling gold to silver ratio, when silver is outpacing gold, tends to correspond with rising prices for both metals, as investors seek higher leverage that silver typically provides.
-
Extremes in the ratio can also mark important turning points for both metals.
Let us examine the gold to silver ratio during the modern era since 2002. The three-part chart below shows:
-
Top – the gold to silver ratio
-
Middle – the price of gold
-
Bottom – the price of silver
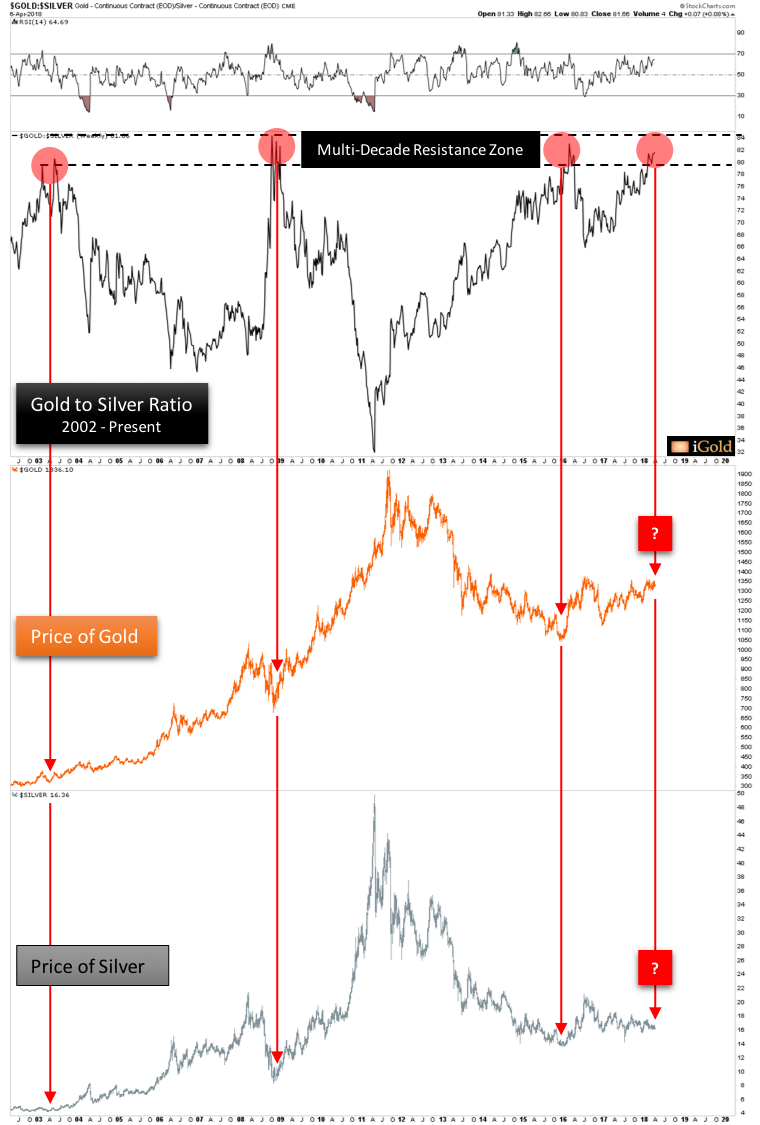
Note how since 2002, whenever the gold to silver ratio has approached its multi-decade resistance zone above 80 (top chart, red callouts), this has marked important lows for both the gold price and the silver price (red arrows).
Indeed, past occasions above 80 on the ratio have marked the ideal buying opportunities for precious metals investors over multi-year periods.
Is History About to Repeat Again?
A number of financial analysts have recently begun to notice the elevated reading in the gold to silver ratio again, and have come to the conclusion that the metals are thus now forming important lows. This may indeed be true – but we believe it is important to let the market show us and not jump to conclusions prematurely.
For the sake of balanced caution, let us examine another period of time in which the gold to silver ratio reached a clear multi-decade resistance zone similar to today. The period in question is from 1970 – 1985:
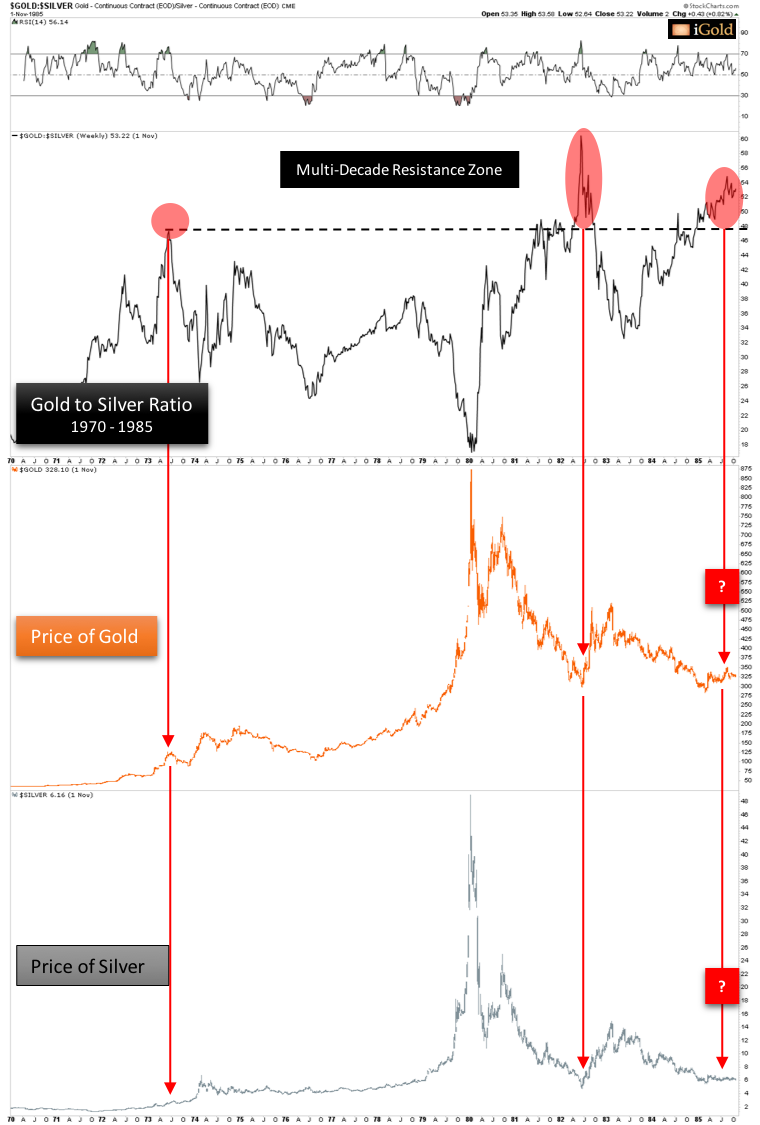
Note that from 1970 – 1985, periods in which the gold to silver ratio exceeded 46 (top chart, red callouts) also corresponded with important lows in price across both metals (red arrows).
When the gold to silver ratio again exceeded 46 in 1985 – a resistance zone which had held for over a decade – analysts at the time again expected that an important buying opportunity was being presented for both gold at $325/oz and silver at $6/oz, respectively.
And while they were correct over the short run, let us advance the above chart forward by another 15 years. Pay special attention to the previous multi-decade resistance zone in the gold to silver ratio:
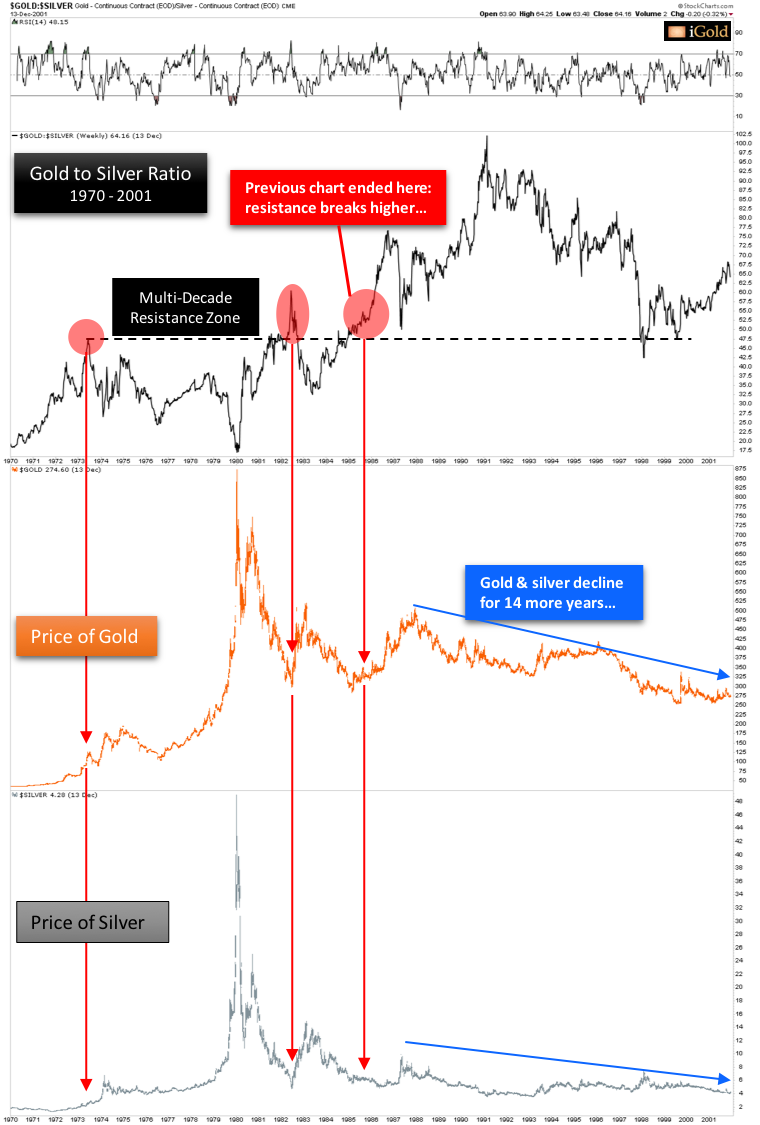
Note how contrary to popular belief, the gold to silver ratio actually broke higher from a previously-perceived ceiling near 46 and reached an astonishing 100 ounces of silver to one ounce of gold by 1991. Analysts who expected the ratio could not climb above its 1982 peak saw silver lose an additional 50% of its value relative to gold as both metals declined in the coming decades.
Although gold did enjoy a rally from $325 to $500 by the end of 1987, this advance failed to materialize into a sustained bull market. Indeed, by 2001, over 14 years later, gold finally bottomed at $250 per ounce while silver bottomed below $4. Meanwhile, the gold to silver ratio remained elevated above its previous 1970 – 1985 resistance zone the entire time.
This was certainly not the outcome that analysts expected in 1985 when they noted that the gold to silver ratio had reached an elevated state at 46 that corresponded with past important lows in the sector.
Back to the Present
Return to the first chart of this article.
The gold to silver ratio is now at a level above 80 that has corresponded closely to important lows and buying opportunities for both metals over the past two decades.
Many analysts believe that another important low is presently being formed across the complex.
However, the example from 1985 shows us to be on alert: a previous multi-decade resistance zone in the gold to silver ratio can indeed resolve higher in certain circumstances.
If the ratio should exceed 84 amidst a continued rise in gold over the next 12 – 18 months, this will be a clear warning signal that the rally should not be trusted.
Takeaway on the Gold to Silver Ratio
In a healthy long-term precious metals market, the gold to silver ratio should be falling. It should not be rising, as we have seen over the past two years.
There is still an opportunity for the gold to silver ratio to peak above 80 and begin to decline over the coming months. But this market must prove itself to us – and soon.
Those who ignore a potential warning sign from the gold to silver ratio over the coming months will stand to suffer a similar fate to those who bought gold or silver from 1985 – 1987… and then saw the price decline for 14 further years.
The gold to silver ratio speaks – to those who listen.
*********

Christopher Aaron began his career as an intelligence analyst for the CIA and Department of Defense. He served two tours to Afghanistan and Iraq between 2006 - 2009, conducting pattern-of-life mapping for military leaders.
Mapping shares similarities with technical analysis of the financial markets because both involve the interpretation of repeating patterns found in human nature. He is the founder of iGold Advisor, providing independent research and analytics on all aspects of the precious metals markets.
He speaks regularly on the cyclical patterns found within the financial markets and on international policy. He has been featured in the New York Times and NPR news amongst other financial publications.
More from Silver Phoenix 500


