Is The Silver Trade Getting Crowded?
 share
share
 share
share
 share
share
 share
share
 share
share
That is the question I am asking myself today after having some time to analyze its Commitments of Traders report.
Here is the Daily Silver chart:

It has had a nice run higher off the April low near 15.50 after it managed to clear the $16.75 region with conviction last week.
It then proceeded to forthwith take out the level noted, “Initial Resistance” over the next two sessions whereupon it ran into selling at the “Secondary Resistance” zone near 17.85-17.75.
It then fell sharply this week breaching the “initial resistance” level as the US Dollar begin strengthening once more.
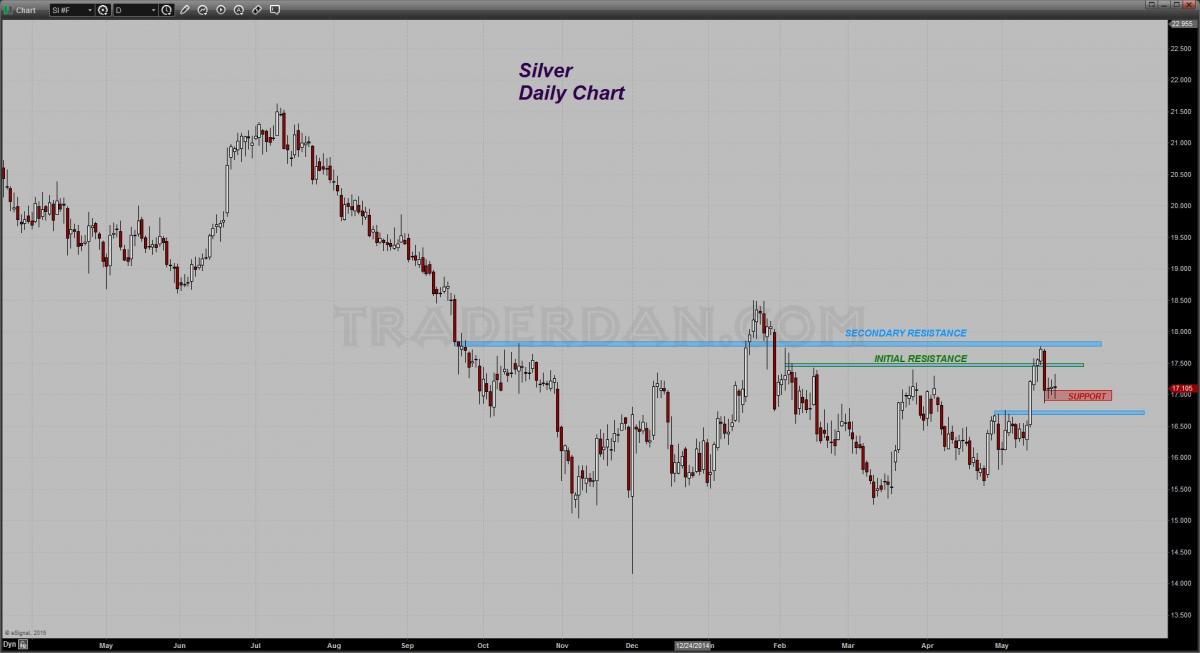
Thus far it has found support near the 17.00 level.
Here is what concerns me however. Both of these next two charts are derived from the Commitments of Traders data.
The first is the NET POSITIONS of all the players involved.
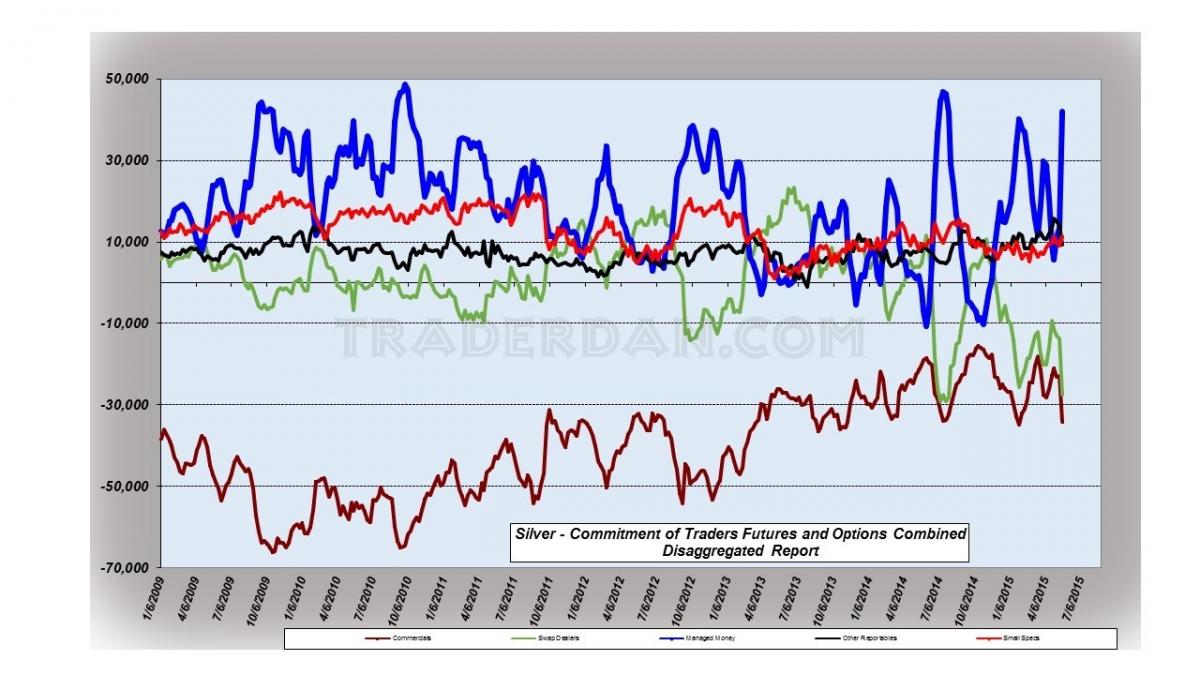
The hedge fund category is approaching their largest net long position of the last six years. That is of a great enough concern in and of itself but this next chart is what really got me!
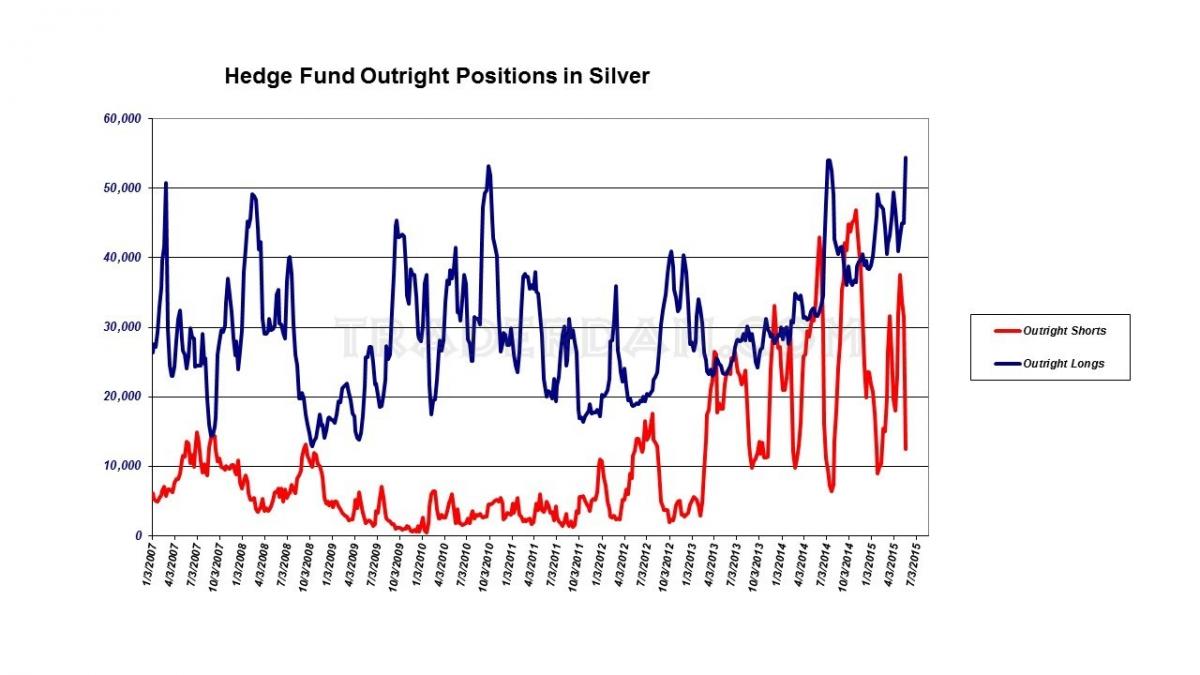
The number of OUTRIGHT LONG positions held by the Hedge Fund category is the largest I have on record. It is so large, it actually exceeds the number this category was holding back when silver was trading closer to $50!
If you look a little closer at the last chart, you can see that the all-time high in long positions that the hedgies held was made back in July of last year ( 2014). At that time, silver was trading near the $22 level.
Here we are some 10 months later and while the hedge funds are holding a record for OUTRIGHT LONG positions, the price of silver is some $5 lower. Obviously, some very concerted selling has been occurring to absorb that much buying by the large funds. Where is that coming from?
Going back to the first of these two COT charts, the one with the NET POSITIONS, take a look at that SWAP DEALER category.

I have written about this group before when it comes to the silver market as their track record for catching turns in this market happens to be very good.
Notice how they INVERSELY MIRROR what the hedge funds are doing. If the hedgies are buying, they are selling. If the hedgies are selling, they are buying. AT the moment, they are selling and are selling rather heavily, as they are a mere 1500 net contracts short of the all time net short position in silver.
What this tells me is that those holding longs in this market had best exercise some caution and not grow complacent.

You can see from looking at that daily chart just how sharp the fall in silver can be when these hedge funds get overextended in silver. Notice that in one single day, the upside gains of the previous three days, and then some, were erased.
It is important to keep in mind, as I have written many, many times before, just because a group of large speculative interests happen to build either a large long position or a large short position, does not necessarily mean one must immediately run for the hills if they happen to be on the same side of the market as that group. The Hedge funds have large assets at their disposal and their firepower, when once trained on any market is a formidable force. I would argue that they are the PRIMARY DRIVERS of our modern futures markets and that one does not become prosperous by willy-nilly taking the other side of their trades.
What I do argue however is that once this category of traders does build a very large position, one must be very careful to closely monitor technical price action and indicators for signs that they are going to exit that position especially if upside momentum begins to show signs of stalling out ( if they are long as they currently are in silver).
Based on what I am currently seeing on this chart silver will need to hold here near the $17 level to prevent a round of serious long liquidation. Any subsequent move lower needs to find buying support around the 16.75-16.65 zone or it will set in motion another round of long liquidation that would then have the potential to carry the market down towards $16.15-$16.00.
These moves in price may not sound like much to most buyers of the physical metal but from a commodity futures market perspective, we are talking about a 5,000 ounce contract with each $1.00 move the equivalent of $5,000 per contract. That is a lot of money for most smaller traders to risk in this market.
There are smaller sized silver futures markets available in which to trade but their liquidity can leave much to be desired at times. However, if one is willing to accept that, those minis are easier on the pocketbook in the event that a trader is wrong.
So where does silver currently stand as far as its short-term technical analysis goes?
Here is the daily chart again:

I have two different indicators I am using on this chart. The first is proprietary. The second or lower one is one which some of the readers might recall I first displayed on a cotton chart.
It is simply the ADX/DMI with the ADX stripped out using just the two Directional Movement Indicators (+DMI and -DMI) and their movements back and forth above and below each other. Their crossings can be used to generate buy and sell signals which I like to verify with some different indicators before acting on them.
When the DMI’s cross and the market is bullish, the bar turns the lavender-like color. When the Directional movement lines register a bearish cross, the bars turn black.
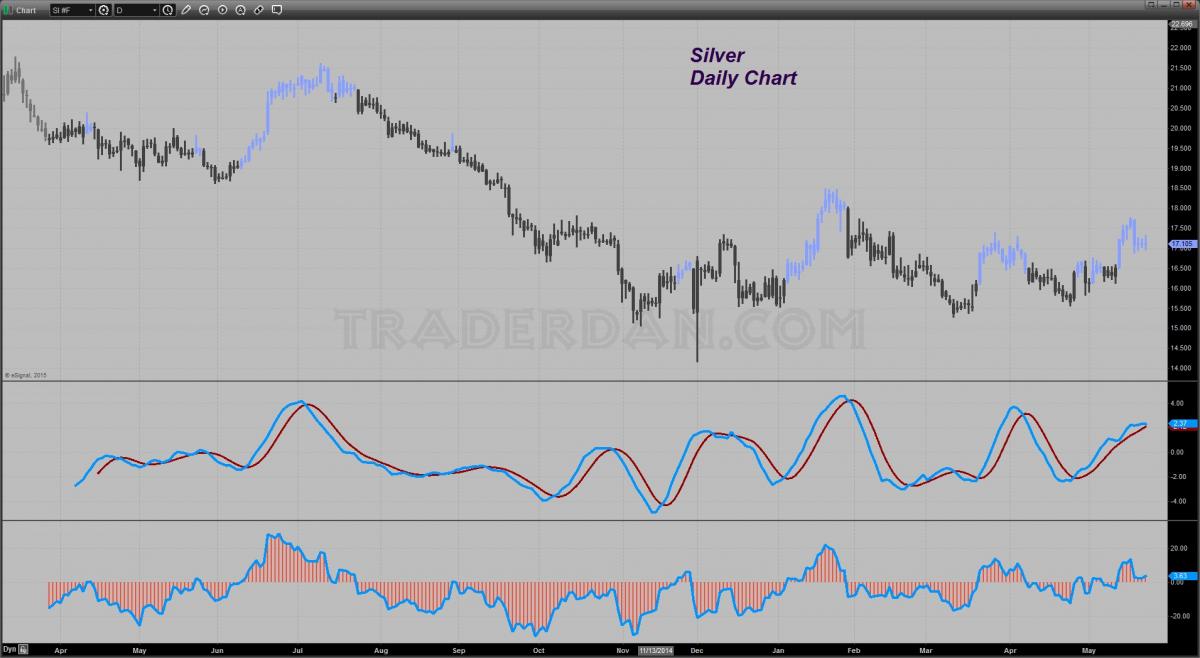
As you can see, there are occasions when the middle indicator contradicts the signal coming from the DMI’s. That is something that is up to the discretion of the trader whether to take the signal or not. For our purposes however, we are still in a bullish mode for silver and thus there has not yet been a sell signal generated although both indicators are showing some signs of a stall in upside momentum.
If the market cannot hold this week’s low, it will more than likely generate a sell signal on both and then that very large long side exposure of the hedge funds will come into play.
If you are long therefore, just be careful and do not get careless. I have no idea whether or not this market will hold here. So much depends on what the US Dollar will do next week. If the Dollar moves higher, I do not think silver will hold. If the Dollar weakens again, silver should bounce from this $17 level and try again at the $17.40-$17.50 region.
Lastly, here is a combination chart showing the silver price overlaid with the USDX.
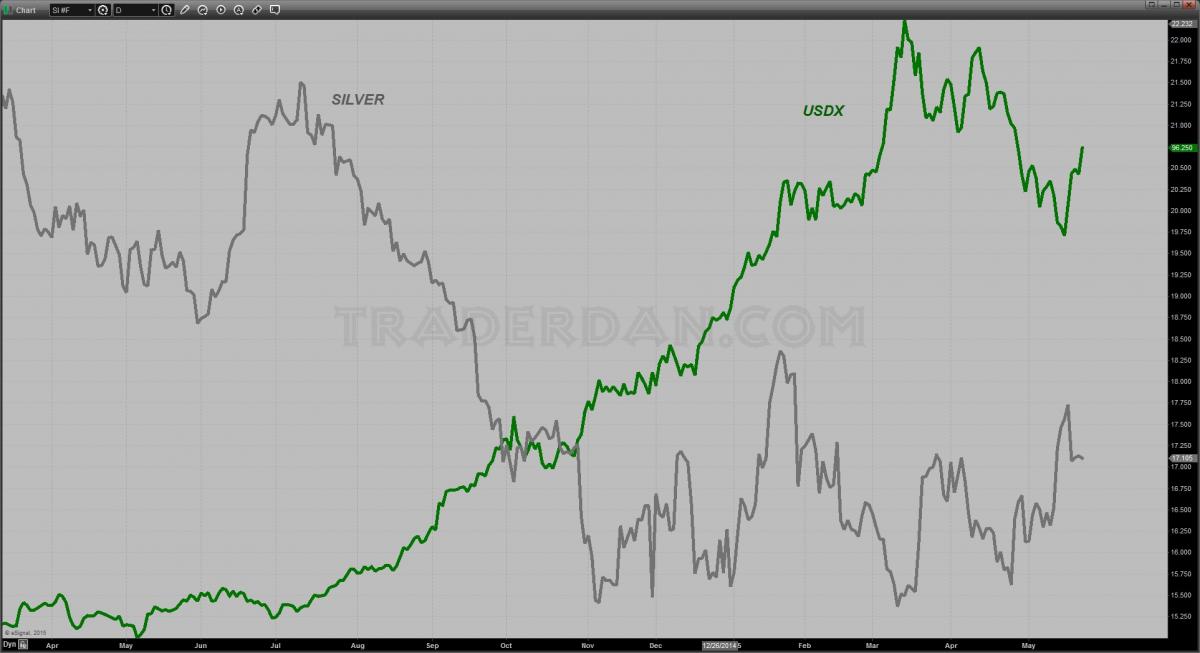
It is interesting to note that when the Dollar peaked in March, silver bottomed and began moving higher. The inverse relationship between the two is certainly not perfect…but this past week, as the Dollar moved higher once more, silver retreated from its overhead resistance level. That is something that anyone who trades this metal must not ignore.
********
Courtesy of Trader Dan http://traderdan.com/
share
share
share
share
share
More from Silver Phoenix 500

