Skin-In-The-Game Investing: Why It Matters


Seven hundred forty million dollars.
That’s how much Bill Gross has reportedly invested of his own cash into the bond fund he manages at Janus Capital Group. The billionaire bond king—who unexpectedly left Pacific Investment Management Company, or PIMCO, in September after a clash with senior management—now owns a little over half of the $1.45 billion fund.
This is likely the most extreme case to be found of a portfolio manager investing in his own fund—or “eating his own cooking”—but it’s certainly not the only one.
 Jackson Park Capital money manager Greg Jackson also has millions personally tied up in one of his firm’s funds. He likes to tell investors that when they go shopping for a fund, one of the decisive factors should be whether the manager invests in it himself. This shows that the manager has faith and conviction in the product.
“If I were a shareholder, that would give me pause [if the manager weren’t invested],” Jackson says. “Why is the fund good enough for me but not good enough for them?”
A recent Wall Street Journal article takes the advice even further: “In the end, knowing that the manager has skin in the game isn’t the sole reason to choose a fund, but it makes sense as a basic criterion or a tiebreaker for selecting between two funds.”
Following this line of thought, Jackson is attracted to companies whose CEOs, officers and other corporate insiders are bullish on their own stock.
“You care a lot more if there’s skin in the game,” Jackson says.
This sentiment is shared by Catalyst Funds portfolio manager David Miller, who even designed a fund that seeks to invest only in companies whose officers are buying shares of their own stock on the open market.
“There are some strong correlations between what the insiders are doing, where the stock is going and its future thereafter,” Miller explains. “They know whether there are going to be earnings or if a company will be acquired. You can also see what they are actually doing with their own personal funds.”
Take Elon Musk, founder and CEO of Tesla Motors, which we own in our Holmes Macro Trends Fund (MEGAX). On May 30, 2013, Musk purchased over $100 million worth of his own company’s stock. Since then, it’s climbed more than 100 percent, compared to the S&P 500 Index’s return of 27 percent.

You do the math of how much Musk has made on his investment.
Consider also Warren Buffett. Writing in the Berkshire Hathaway owner’s manual, Buffett reassures shareholders that “most of our directors have a major portion of their net worth invested in the company. We eat our own cooking.”
Speaking of Buffett, his annual letters to shareholders are always a treat, full of wit and wisdom that only someone of his brilliance and investing experience can articulate. The fiftieth anniversary letter was just released, which you can read here.
More recently, 89-year-old entrepreneur and philanthropist Alfred Mann altruistically put up $1 billion of his own capital to keep afloat his company MannKind, which manufacturers the groundbreaking Afrezza, an insulin treatment that diabetics inhale instead of inject. Mann is also involved with Second Sight Medical, which IPO’d in November. The company makes and sells advanced retinal implants that restore partial vision to the blind.
In October of last year, the Financial Times wrote: “Equity investors like to see that the chief executives of the companies in which they invest have a decent shareholding; they like to see remuneration packages that include lots of stock compensation.”
Simply put, any kind of insider buying is typically a good sign. As Investopedia explains:
Executives can talk all they want, but the best vote of confidence is putting one’s own money on the line just like outside investors!
 Walking the Walk
At U.S. Global Investors, we not only share this philosophy but also practice it. Like Gross, Musk and Buffett, we have skin in the game, an expression that Buffett is often credited with coining.
More to the point, whenever one of our portfolio managers receives a performance bonus, half of it he gets in cash while the other half goes directly into the fund he manages.
As for myself, I’m invested in all nine of our funds, the most significant position being in our Near-Term Tax Free Fund (NEARX). On top of that, I’m also a U.S. Global Investors (GROW) shareholder. The chart to the right, taken from our statement of additional information (SAI), shows that every one of our funds has at least $50,000 in manager ownership.
I believe it’s absolutely essential for our investment team, officers and I to have some skin in the game, to eat our own cooking, to feel the pinch when a fund disappoints and the exhilaration when it outperforms. Because we face the very same risks and rewards that our investors do, we’re motivated and incentivized to exert greater care and effort into the management of our funds.
And let’s be clear. Manager ownership is so much more than a symbolic gesture of faith in the product and empathy for the investor. Indeed, there’s empirical proof that such funds have tended to outperform those that have no manager investment, based on studies conducted by Morningstar, Capital Group and others.
Back in 2008, Morningstar’s Director of Fund Research, Russel Kinnel, set out to determine what percentage of managers nationwide owned a portion of their own funds. The results, as he described them, were “staggering”:
Looking at the data, the figures that jump off the page are those where no one invested a dime. At U.S. stock funds, 47 percent report no manager ownership. And it gets worse from there. Fully 61 percent of foreign-stock funds have no ownership, 66 percent of taxable bond funds have no ownership, 71 percent of balanced funds put up goose eggs, and 80 percent of muni funds lack ownership.
 Eighty percent! Of muni funds! I think it’s worth repeating that my largest position is in our firm’s muni bond fund, which has delivered 20 straight years of positive growth. Out of 25,000 equity and bond funds, only 30—NEARX among them—have been able to achieve such a feat.
Granted, the Morningstar data is seven years old, but it’s “staggering” nonetheless. Since 2005—three years prior to the study—the Securities and Exchange Commission (SEC) has required investment firms to disclose manager ownership in their annual SAIs. Given this level of transparency, you’d think more firms would encourage their managers to put some skin in the game.
Because putting your own money on the line usually fosters a greater sense of urgency and commitment to performance.
Kinnel reiterated the benefits of manager investment in a January 2015 interview:
We looked at ownership levels from five years ago and then performance over the ensuing five years to test out whether you would have had improved results if you had chosen along the lines of manager ownership, and it looks like you would have.
********
Please consider carefully a fund’s investment objectives, risks, charges and expenses. For this and other important information, obtain a fund prospectus by visiting www.usfunds.com or by calling 1-800-US-FUNDS (1-800-873-8637). Read it carefully before investing. Distributed by U.S. Global Brokerage, Inc.
Total Annualized Returns as of 12/31/2014:
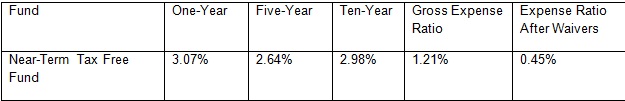
Expense ratio as stated in the most recent prospectus. The expense ratio after waivers is a contractual limit through December 31, 2015, for the Near-Term Tax Free Fund, on total fund operating expenses (exclusive of acquired fund fees and expenses, extraordinary expenses, taxes, brokerage commissions and interest). Performance data quoted above is historical. Past performance is no guarantee of future results. Results reflect the reinvestment of dividends and other earnings. For a portion of periods, the fund had expense limitations, without which returns would have been lower. Current performance may be higher or lower than the performance data quoted. The principal value and investment return of an investment will fluctuate so that your shares, when redeemed, may be worth more or less than their original cost. Performance does not include the effect of any direct fees described in the fund’s prospectus which, if applicable, would lower your total returns. Performance quoted for periods of one year or less is cumulative and not annualized. Obtain performance data current to the most recent month-end at www.usfunds.com or 1-800-US-FUNDS.
Past performance does not guarantee future results.
Stock markets can be volatile and share prices can fluctuate in response to sector-related and other risks as described in the fund prospectus.
Bond funds are subject to interest-rate risk; their value declines as interest rates rise. Though the Near-Term Tax Free Fund seeks minimal fluctuations in share price, it is subject to the risk that the credit quality of a portfolio holding could decline, as well as risk related to changes in the economic conditions of a state, region or issuer. These risks could cause the fund’s share price to decline. Tax-exempt income is federal income tax free. A portion of this income may be subject to state and local taxes and at times the alternative minimum tax. The Near-Term Tax Free Fund may invest up to 20% of its assets in securities that pay taxable interest. Income or fund distributions attributable to capital gains are usually subject to both state and federal income taxes.
The S&P 500 Stock Index is a widely recognized capitalization-weighted index of 500 common stock prices in U.S. companies.
Fund portfolios are actively managed, and holdings may change daily. Holdings are reported as of the most recent quarter-end. Holdings in the Holmes Macro Trend Fund and Near-Term Tax Free Fund as a percentage of net assets as of 12/31/2014: Berkshire Hathaway 0.00%, Capital Group International 0.00%, Janus Capital Group 0.00%, MannKind Corp. 0.00%, Pacific Investment Management Company 0.00%, Second Sight Medical Products 0.00%, Tesla Motors 1.44% Holmes Macro Trends Fund.
All opinions expressed and data provided are subject to change without notice. Some of these opinions may not be appropriate to every investor. By clicking the link(s) above, you will be directed to a third-party website(s). U.S. Global Investors does not endorse all information supplied by this/these website(s) and is not responsible for its/their content.
 Frank Holmes is the CEO and Chief Investment Officer of U.S. Global Investors. Mr. Holmes purchased a controlling interest in U.S. Global Investors in 1989 and became the firm’s chief investment officer in 1999. Under his guidance, the company’s funds have received numerous awards and honors including more than two dozen Lipper Fund Awards and certificates. In 2006, Mr. Holmes was selected mining fund manager of the year by the Mining Journal. He is also the co-author of “The Goldwatcher: Demystifying Gold Investing.” Mr. Holmes is engaged in a number of international philanthropies. He is a member of the President’s Circle and on the investment committee of the International Crisis Group, which works to resolve conflict around the world. He is also an advisor to the William J. Clinton Foundation on sustainable development in countries with resource-based economies. Mr. Holmes is a native of Toronto and is a graduate of the University of Western Ontario with a bachelor’s degree in economics. He is a former president and chairman of the Toronto Society of the Investment Dealers Association. Mr. Holmes is a much-sought-after keynote speaker at national and international investment conferences. He is also a regular commentator on the financial television networks CNBC, Bloomberg and Fox Business, and has been profiled by Fortune, Barron’s, The Financial Times and other publications. Visit the U.S. Global Investors website at http://www.usfunds.com.
More from Silver Phoenix 500