S&P500 : A Butcher’s Market ( Chop Chop Chop)
 share
share
 share
share
 share
share
 share
share
 share
share
It sure does seem as if the vast majority of our markets are stuck in sideways trading patterns, does it not? Just about the time some look as if they are going to mount an upside breakout, they fail and fall back down once again. The flip side is that some markets look as if they are going to stage a downside breakout, they reverse higher and back up they go. The result of all of this has been to slice and dice or chop and shred traders who are attempting to build any sort of POSITIONS BASED ON LONGER TERM VIEWS.
In order to survive and prosper, traders are being forced into becoming scalpers or day traders, holding positions for only short periods of time and reversing back and forth very quickly between playing the long side and playing the short side.
The same goes for the S&P 500, which as you can see from the chart, has done quite a bit of back and forth this year only with the result of barely being up since the start of trading in 2015. ” Full of sound and fury, signifying nothing”, comes to mind.
Traders are seeing Q1 economic data as less than stellar and are concerned about earnings for the first quarter disappointing. While many are expecting earnings and economic growth to recover in Q2 and beyond, the facts are that for the time being, investors are somewhat dubious over the near term prospects for equities. That is leading to some very volatile back and forth trade in which no clear trend has emerged.

That can be seen from the following chart which shows the Bollinger bands continuing to contract as the Bandwidth indicator makes abundantly clear. So far this year there has only been a brief period during which the S&P looked as if it was reasserting a more vigorous up-trending move. That took place in February where the bands were widening out as the index moved strongly higher notching a new all-time high in the process.
Since then the market has stalled out and been unable to press higher. Support however has remained intact at the lower band.
Until we see some further evidence of consistent improvement in US economic data, this looks to be the pattern that will continue in the S&P. Meanwhile, Greece fears, China concerns over the raising of margins and relaxation of rules governing short selling, plus earnings concerns in the US are working to provide selling pressure in equities with bulls banking on improvements as the year progresses. Currently neither bulls or bears have a clear cut advantage in this particular index although the intermediate term trend favors the bulls.

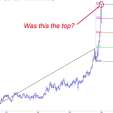
As you can see on that time frame, the trend higher seems relentless in spite of the fact that one bearish divergence signal after another has been flashing since last summer. That has not stopped the bulls from pushing this thing higher however. As a matter of fact, the RSI, while showing these negative divergences ( price makes a higher high while the technical indicator makes a lower high), has maintained its footing solidly above the 40 level, a level which generally will not hold if the market posture shifts from bullish to bearish.
In other words, the sideways action of the RSI tells us that while upside momentum continues to wane, the posture of this market remains one of a bull.

The index would need to fail near 1800 before one could say that from a technical perspective, there is any sign of a definitive top. It could fall to that level and while it would obviously disappoint the bulls, unless the RSI fell below the 40 level, one would still have to call such a move lower merely a retracement lower in an ongoing, albeit grindingly slow, bull market.
********
Courtesy of Trader Dan http://traderdan.com/
share
share
share
share
share
More from Silver Phoenix 500