US Stock Market On Shaky Ground!
 share
share
 share
share
 share
share
 share
share
 share
share
 Last article, I wrote that volume studies showed recent net outflows even as the market moved up during the recent OPEX /FOMC rally. I talked about the Rising Wedge, which when broken would cause a big drop. Well, we have some cracks showing up on the daily MACD indicator that is implying some tough days ahead for the US stock market. I thought we would rally more than we did this week, but the Monday to Wednesday drop this last week caused me to see the light, so to speak, about the proper e-wave count going forward. It is implying a “b” wave in process in an a-b-c down move. The last ‘c’ wave up of “b” is due to terminate on Monday April 6 near 2095/96 SPX and next week should see a repeat of what happened from March 23-26. That means we gap up Monday to set up for the drop. I have a downside target near 2026 Thursday April 9, and the likelihood we see a double bottom on Monday April 13 near 2028.
The next step is a snapback rally to test the bottom of the rising wedge near 2101 on Tuesday April 21. Important Bradley turns are due on April 3, April 14 and April 22. We have Wave (a) on March 13, wave (b) due on April 20-21 and Wave (c) due on May 12 near 1935 (Bradley due May 10, a Sunday). We likely will trade an irregular bottom much like we did into the February 2 bottom this year with bottoms due on May 26 and June 9 (a .618 retracement of the final a-b-c rally labeled A on December 26) near 1924-25. There are important Bradley turns due on both those latter dates in May and June. The May 12 low is a .618 retracement of the entire rally from October 15 to February 24 at 1935 SPX.
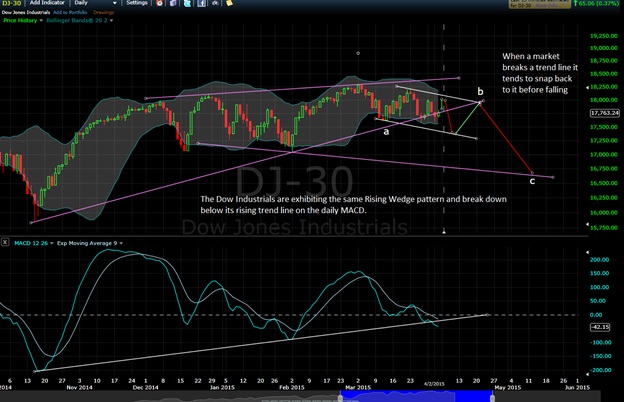
The charts below show the MACD daily on the SPX500 and Dow Industrials:
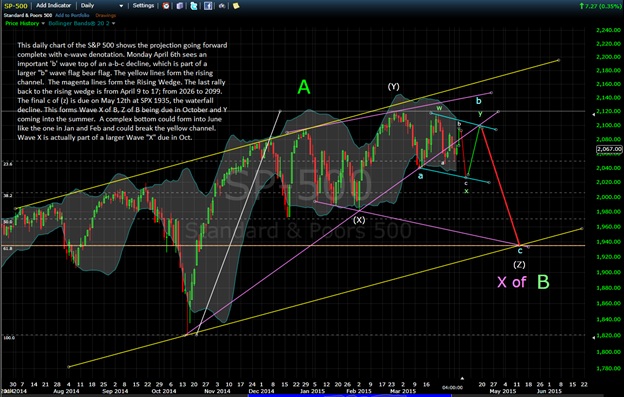
I don’t show the irregular bottom projection into May 26 and June 9 on the chart of SPX500. Obviously, it will break the yellow channel, portending things to come. Out of this bottoming pattern in January and February came the rally to new highs in latter February and early March. I expect the same out of the June 9 low, before we crack even harder into October to near 1700 or below per the Irregular Megaphone Pattern discussed before.
********
Courtesy of http://www.blustarmarkettimer.info
Copyright 2015 BluStar Market Timer. All Rights Reserved.
Disclaimer: The information provided by the BluStar Market Timer is to be used for educational purposes only. We do not recommend the buying or selling of any securities, are not registered investment advisers and do not offer investment advice. Stock market investing is considered risky. Market timers can and do make mistakes. Past performance is never a guarantee of future performance.
share
share
share
share
share