Will Gold’s Multi-Year Down Trend Resume in Q2?
New York (Mar 26) Gold embarked on an aggressive recovery in the first quarter of 2016, buoyed by a slump in Federal Reserve rate hike expectations. A dovish shift in investors’ policy bets reduces the opportunity cost to owning gold versus interest-bearing assets while boosting demand for alternative stores of value to hedge against increased inflation risk. Prices traded to just shy of the $1300/oz figure, hitting the highest levels in over a year.
Will Gold’s Multi-Year Down Trend Resume in Q2?
When the Fed projected 100bps in 2016 tightening following post-QE rates “liftoff” in December, traders priced in just 50bps. As the calendar turned to 2016, the prospect of a more hawkish central bank than had been accounted for in asset prices triggered risk aversion. Dropping stocks – a proxy for broader sentiment trends – echoed into priced-in Fed views as investors questioned whether policymakers will make good on stimulus withdrawal amid market turmoil. After briefly dropping rate increases from the outlook entirely in February, traders settled on one 25bps increase before year-end.
Fed Chair Janet Yellen and company responded by slashing the projected rate hike path to imply two 25bps hikes this year. Subsequent comments from central bank officials offered a relatively upbeat tone on domestic prospects and cited external forces including the slowdown in China as the rationale for opting for a more cautious stance. Taken together, these moves may imply a new strategy aimed at realigning official and market-based rate hike bets, presumably aimed at setting the stage for a smoother hike in June.
Indeed, the case for tightening remains compelling. The unemployment rate has dropped to 4.9 percent, the lowest in eight years. Meanwhile, the Fed’s favored core PCE inflation gauge showed price growth accelerated to a three-year high of 1.7 percent year-on-year in January. Critically, this happened before headwinds to price growth eased as the US Dollar weakened and crude oil prices rebounded in February, meaning the Fed’s 2 percent target is probably even closer to being reached.
Realized US economic data outcomes have steadily improved relative to consensus forecasts since early February. More of the same coupled with a coordinated Fed communication effort aimed at smoothing the normalization process boost the priced-in policy outlook. This is likely to cap gold’s advance and push prices lower, painting recent gains as corrective within the context of a multi-year down trend initiated in late 2011.
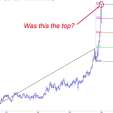
Back in December we noted that, “an outside weekly-reversal candle took shape on the rebound off (this) key support with building divergence on the daily & weekly charts suggesting that the short-side remains vulnerable near-term heading into the start of the year. . . Bottom line: we’ll be looking for a push higher in early 1Q.” Indeed the start of the year saw a massive advance in gold with prices rallying a staggering 22.7% off the 2015 low before pulling back in early March. The move marks the largest quarterly range for gold since 3Q of 2013 with prices up 17.6% Year-to-date at the time this report was written.
Although our outlook remains weighted to the topside, we’re likely to see some weakness before pushing higher as we head into the second-quarter. As we noted last year, since the late-2011 record high, gold prices have tended to make the yearly high in price within the first quarter and breach of the 2016 high over the next few months would offer further conviction on a broader turn higher in bullion. Such a scenario eyes topside resistance objectives at the 2015 high-week close at 1293 backed by the 2014 high-week close at 1334 and key Fibonacci resistance at 1380/97. Note that a basic trend line resistance extending off the 2011 and 2012 highs also converges on this key resistance range into the close of April / open of May trade.
Interim support rests at the confluence of a median-line extending off the July 2015 low and a basic 38.2% retracement of the advance off last year’s low at 1193. We’ll be on the lookout for long-entries into this region with a break sub-1151/55 needed to invalidate the broader long-bias. This region is defined by the 61.8% retracement of the late-2008 advance, the 61.8% extension of the decline off the record 2011 high and the 52-week moving average. Bottom line: expect some weakness heading into the second-quarter with pullbacks likely to offer favorable long entries while above 1155 targeting the 2011 trend line resistance.
Source: DailyFX