A 14 Handle On Silver…Again


 What’s the difference between the Supply and Demand Report November 1, and the Supply and Demand Report November 8? Just a minor punctuation change. Last week, we asked (rhetorically) if silver would have a 14 handle again.
This week, the market answered. Why yes, yes we can!
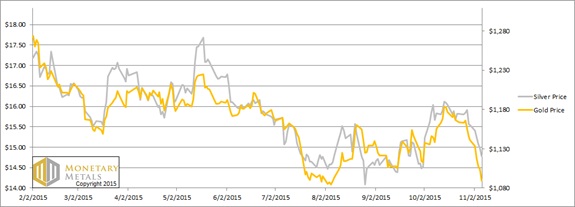
Silver closed the week, trading at $14.78. This is down $0.76 from last Friday and almost 20 cents under our fundamental price from that date. The price of gold also dropped, $52. This is quite a discount to what we calculate as its fundamental price.
So what happened? It’s always a challenge to explain a market price move in terms of a concurrent or preceding event, and financial reporters get it wrong all the time. In this case we feel pretty confident that the driver was the nonfarm payroll report, as the price of gold plunged about $15 within a minute of the release of the data on Friday.
Why? What has the payroll data got to do with the price of tea in China or the price of gold in New York? Traders (likely not hoarders, but speculators) are trying to figure out if the Fed will: (A) cut interest rates, (B) hold them steady, or (C) hike them. If they are to hike, then everyone wants to know when. Since the Fed has said it wants to see full employment as one measure of a recovery before risking a rate increase, the market looks to the Bureau of Labor Statistics for hints.
Such is life in a centrally planned world, where the most important price of all—the price of money—is administered.
There’s only one flaw in this approach. The price of gold does not correlate to the money supply or to the interest rate. In the 1970’s, we had a rapidly rising price of gold and skyrocketing interest rates. In January of 1970, one could have bought gold (if one was not an American—in America, it was illegal) gold for $36.56. By December 1979, the price was up to $593.84 which is a 16-fold increase. More than half of this gain occurred from 1977-1979, which saw the price rise from about $132 to $594.
During that same period 1977-1979, the interest rate on the 1-year Treasury went from under 5% to almost 12%, well over a double.
As to more recent years, let’s look at a graph of 2001 through present, overlaying the gold price with the interest rate.
The Price of Gold and Fed Funds Rate
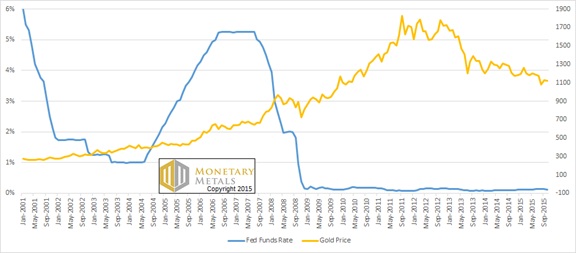
Here’s a trick question. If we told you the next interest rate trend, how would you bet on the price of gold?
You can’t.
We can tell you that our theory calls for a continuation of the 34-year trend: interest rates are falling worldwide. Although we can’t predict what the Fed will say at their next meeting, we don’t expect any major hikes, because the Fed cannot do it. We would have thought a 25bps increase was possible, but it seems even that meager rise would cause too much difficulty.
As to predicting the price of gold, we have a different methodology. Read on for our picture of supply and demand fundamentals…
First, here is the graph of the metals’ prices.
The Prices of Gold and Silver
We are interested in the changing equilibrium created when some market participants are accumulating hoards and others are dishoarding. Of course, what makes it exciting is that speculators can (temporarily) exaggerate or fight against the trend. The speculators are often acting on rumors, technical analysis, or partial data about flows into or out of one corner of the market. That kind of information can’t tell them whether the globe, on net, is hoarding or dishoarding.
One could point out that gold does not, on net, go into or out of anything. Yes, that is true. But it can come out of hoards and into carry trades. That is what we study. The gold basis tells us about this dynamic.
Conventional techniques for analyzing supply and demand are inapplicable to gold and silver, because the monetary metals have such high inventories. In normal commodities, inventories divided by annual production (stocks to flows) can be measured in months. The world just does not keep much inventory in wheat or oil.
With gold and silver, stocks to flows is measured in decades. Every ounce of those massive stockpiles is potential supply. Everyone on the planet is potential demand. At the right price, and under the right conditions. Looking at incremental changes in mine output or electronic manufacturing is not helpful to predict the future prices of the metals. For an introduction and guide to our concepts and theory, click here.
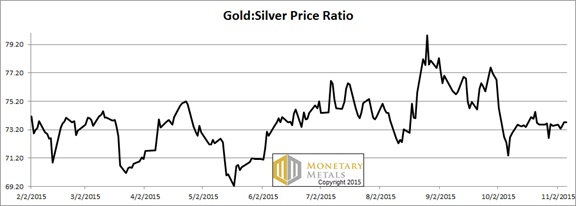
Next, this is a graph of the gold price measured in silver, otherwise known as the gold to silver ratio. The ratio barely moved this week, upwards.
The Ratio of the Gold Price to the Silver Price
For each metal, we will look at a graph of the basis and cobasis overlaid with the price of the dollar in terms of the respective metal. It will make it easier to provide brief commentary. The dollar will be represented in green, the basis in blue and cobasis in red.
Here is the gold graph.
The Gold Basis and Cobasis and the Dollar Price
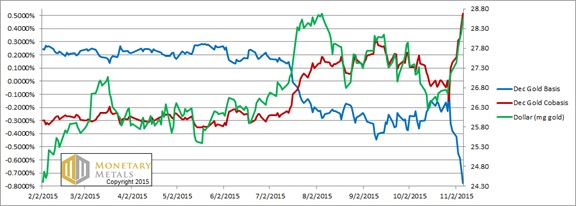
We’re still in the same mode. As the price of the dollar rises (i.e. people sell gold, i.e. the price of gold as measured in dollars falls) the scarcity of gold rises (i.e. the cobasis). The red and green lines continue together. Unlike the Fed Funds Rate and the price of gold, there is no an uncanny correlation between the cobasis and the dollar price.
This means that sometimes, speculators are selling futures (typically purchased with leverage) and sometimes they are buying. They have no effect on the price at which supply and demand would clear.
Which, as the price of gold dropped by $52, we calculate moved by only $2. Up. Does this mean gold will trade at almost $200 higher by tomorrow morning? Probably not. So what does it mean? It means gold is on sale, offered at a discount thanks to speculators that are going to lose a large number of dollars one of these days.
Now let’s look at silver.
The Silver Basis and Cobasis and the Dollar Price
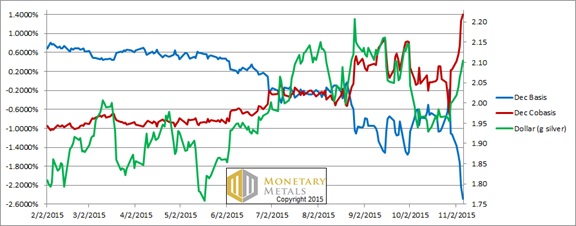
The silver price did fall relatively quickly, less than a month since we noted the market price was above the fundamental.
This week, the market price fell hard. The graph shows that the scarcity of silver rose even hard (though bear in mind that silver has much more of a cobasis distortion field than gold, as the near contract tends to tip into temporary backwardation before gold does, and deeper).
The fundamental silver price fell about a dime this week, thus putting the market price under the fundamental. While that’s a better place to be, if one is a silver bettor, we wouldn’t bet either way on silver right now. The action is going to depend on whether momentum continues to carry the price lower, or whether there’s a sharp rebound as speculators jump to the other side. Maybe those with razor-sharp technical models can make a buck here. That’s not for us.
********
Do you support the gold standard? Please come and be counted. Show the legislature and governor in Arizona that honest money is popular! Please come to the Monetary
Innovation Conference in Phoenix on Nov 17 (Keith Weiner is a speaker). At the conference, speakers will discuss gold and how innovators are using it to solve real problems for real people. Please click here to register. After the conference, we may put on a Monetary Metals seminar if there is sufficient interest. Please click here if interested (different link).
© 2015 Monetary Metals
 Dr. Keith Weiner is the CEO of Monetary Metals and the president of the Gold Standard Institute USA. Keith is a leading authority in the areas of gold, money, and credit and has made important contributions to the development of trading techniques founded upon the analysis of bid-ask spreads. Keith is a sought after speaker and regularly writes on economics. He is an Objectivist, and has his PhD from the New Austrian School of Economics. His website is www.monetary-metals.com.
More from Silver Phoenix 500


