ASX200 Aussie Stock Market’s Final Fling


It seems like only yesterday I was writing about the Aussie stock market, the ASX200. Oh, hang on, it was. Well, only a few days ago. Since then price has exploded to new rally highs. While I was confident of this happening I wasn’t expecting it now.
Price has launched higher parabolic style in part due to the Reserve Bank of Australia cutting the cash rate by 0.25%. But fundamentals are used as excuses and I don’t make excuses. I was wrong in thinking price wouldn’t make new rally highs now.
So let’s quickly update this explosive situation using the daily and monthly charts.
ASX200 DAILY CHART
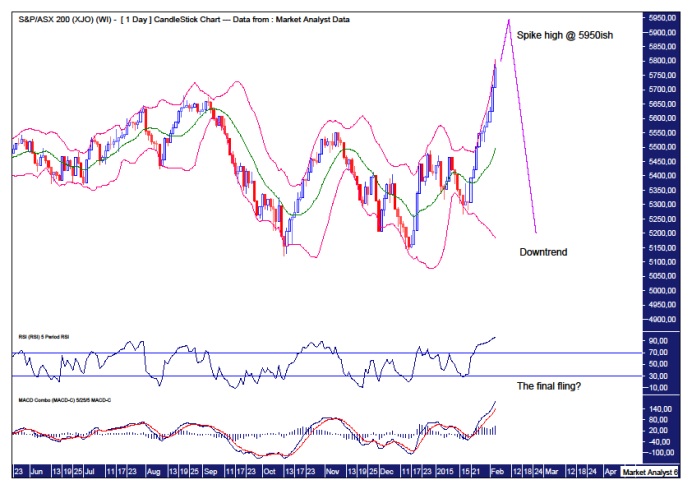
We can see the move up from recent low is certainly of the parabolic variety. Parabolic moves higher are often seen at the end of bull trends.
Just as I was previously confident of new rally highs being made, so too am I reasonably confident of the final rally high level. As mentioned in previous analysis, I am looking for a rally high around 5959 which stems from the 76.4% Fibonacci retracement level of the move down from 2007 top to 2009 low. I think price is now spiking up to this level.
The Bollinger Bands show price clinging to the upper band. This is where I went wrong in the previous analysis in thinking price was starting to move away from the upper band. This was put paid to immediately with a strong move up to recapture the upper band.
If the Relative Strength Indicator was overbought a few days ago it is even more so now. This looks like a big outlier reading coming up.
The Moving Average Convergence Divergence (MACD) is also going up hard.
Both these lower indicators look like they are having one last lash. The final fling!
ASX200 MONTHLY CHART
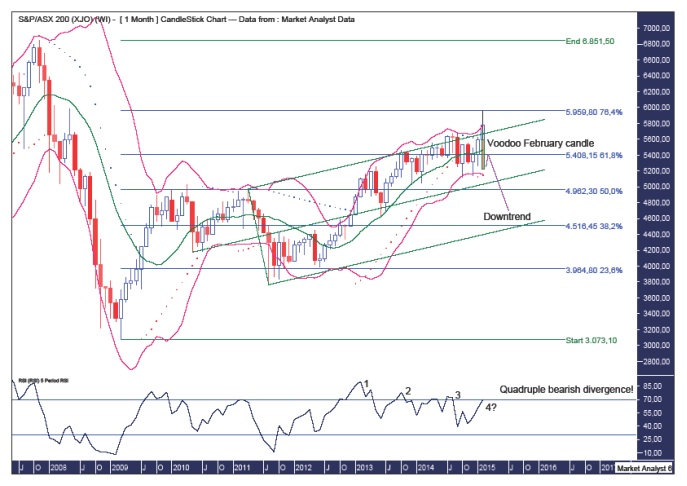
I have added the Fibonacci retracement levels which show my long term target for rally high being the 76.4% level at 5959.
I have added Bollinger Bands and in previous analysis I stated I wanted to see the final rally high do a little “up and over” of the upper band. This looks to be in play with price looking to trade well above the upper band.
I have drawn an Andrew’s Pitchfork in which I also stated I wanted to see price to an “up and over” of the upper pitchfork trend line. Price is already doing this now.
The RSI shows this coming price high looks set to be accompanied by a quadruple bearish divergence. Normally a triple is sufficient while a quadruple just hammers the point home!
Now I remain very bearish for the month of February and so once the spike high is in place over the coming days, if I am reading this correctly of course, then I expect a big reversal and fast paced move down to finish the month well in the red.
I have drawn Voodoo style how I am currently expecting the February candle to look. It shows a long wick up to put in the high around 5959 before reversing back down and closing the month on its lows.
I have added a Parabolic Stop and Reverse (PSAR) indicator which shows the dots on the downside which act as support. I expect the February low to be just above that support which is at 5149. If this plays out as expected then I would think a small rally then takes place at the start of March before price turns back down and smashes through this support.
So it looks like this final fling in the Aussie stock market is about to turn ugly.
********.
My website is www.thevoodooanalyst.com
© 2014 Copyright The Voodoo Analyst - All Rights Reserved
Disclaimer: The above is a matter of opinion provided for general information purposes only and is not intended as investment advice. Information and analysis above are derived from sources and utilising methods believed to be reliable, but we cannot accept responsibility for any losses you may incur as a result of this analysis. Individuals should consult with their personal financial advisors. Put simply, it is JUST MY OPINION.
More from Silver Phoenix 500


