The Brightening Outlook For S&P500 Bulls


I doubted that Thursday's downswing was a shot across the bow courtesy of the bears, and instead laid out the case for why the stock upswing is likely to renew itself when I looked at the big picture. And so far, the stock bull run remains intact, regardless of all the non-confirmations out there.
As always, I'll lay out the facts in search of market's upcoming direction, and they still lead me to think that the stock uptrend has more chances of continuing than not.
The bulls are prevailing in the clashing narrative and facts on the ground:
(…) I say so despite the uptrend in new U.S. Covid-19 cases that has many states stepping back from the reopening, rekindling lockdown speculations. I say so despite the Fed having its foot off the pedal in recent weeks, which makes for more players looking at the exit door.
Treasuries aren't relenting. It's corona vaccine and expensive treatment hype against fear. Fear of surging cases and lockdowns that would derail the fragile real economy even more.
Just as I wrote in Friday’s Stock Trading Alert:
(…) Central banks are standing ready to act, and money printing remains in our future. The greatest real policy risks I see, concern lockdown miscalculations and new stimulus measures.
Any corona progress hopes lift up the cyclicals, and it isn't just the tech, healthcare or materials that are having a good day. There is no mad rush into dollars, just into selected U.S. sectors and Treasuries. Greed is rising but isn't at extremes. The stock bull isn't breaking down – there is no sign of it.
Let's dive right into the S&P 500 performance.
S&P 500 in the Medium- and Short-Run
I’ll start today's flagship Stock Trading Alert with the weekly chart perspective (charts courtesy of http://stockcharts.com ):
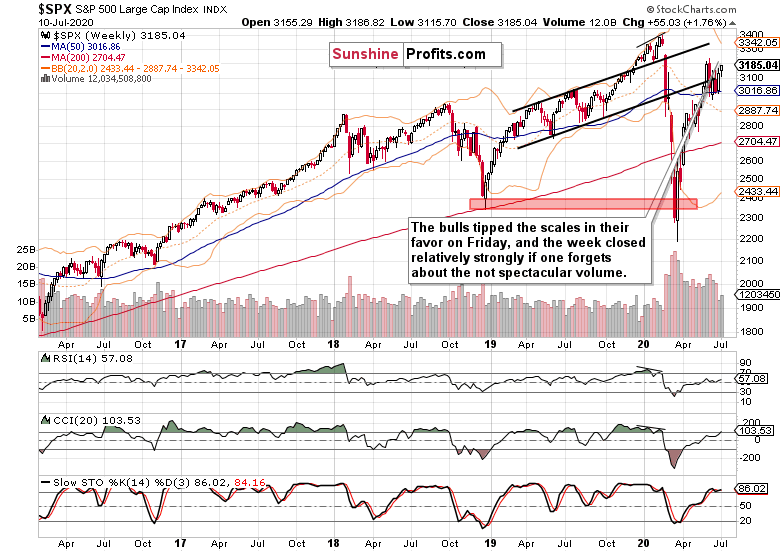
After the prior rebound off the 50-week moving average, the S&P 500 extended gains in the past week. The weekly volume has encouragingly improved, if ever so slightly. Couple that with the weekly indicators though, and that still isn't enough to call the chart unequivocally bullish.
Bullish, yes. That's part of the anticipated rocky ride through the summer. Elections uncertainty isn't rocking the markets as much as when November 3 comes knocking on the door. Real economy rebound, employment data, and corona policy responses will play a greater role these weeks.
All in all, the weekly chart is bullish-to-neutral in its implications.
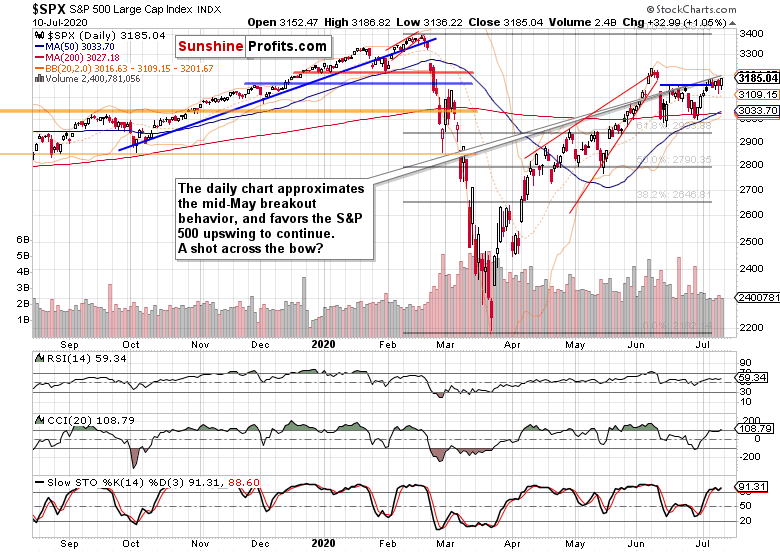
If the second peek above the horizontal line connecting mid-June tops didn't stick, perhaps the third one will. The volume print doesn't help deciphering that, but chances are the strong runup to Friday's closing bell would carry over into Monday's session.
Still, the current dynamics reminds me of the S&P 500 taking on the late April and early May highs. After a prolonged consolidation with stocks trading more often than not above the resistance, the S&P 500 just spurted higher one day. Chances are we'll see history repeated.
Credit markets support this assessment.
The Credit Markets’ Point of View
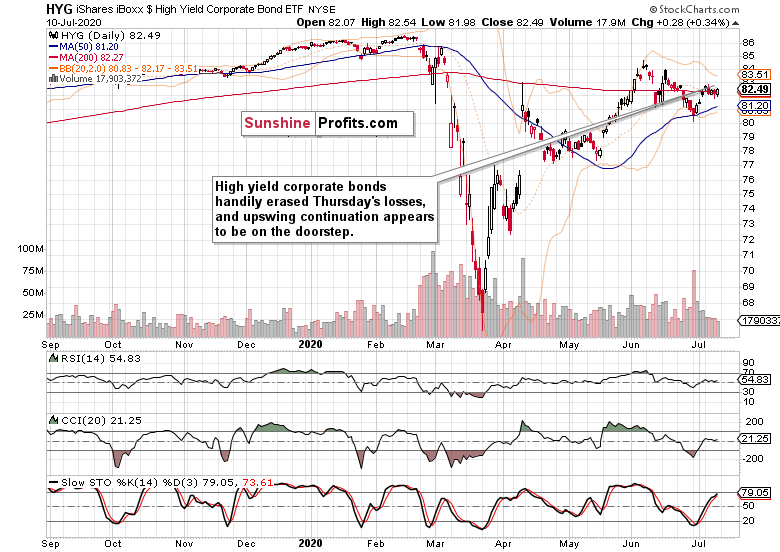
High yield corporate bonds (HYG ETF) quickly overcame the weak selling wave, and marched higher throughout the regular session. After the flag-like consolidation, the upswing looks ready to go on, regardless of not spectacular volume on Friday.
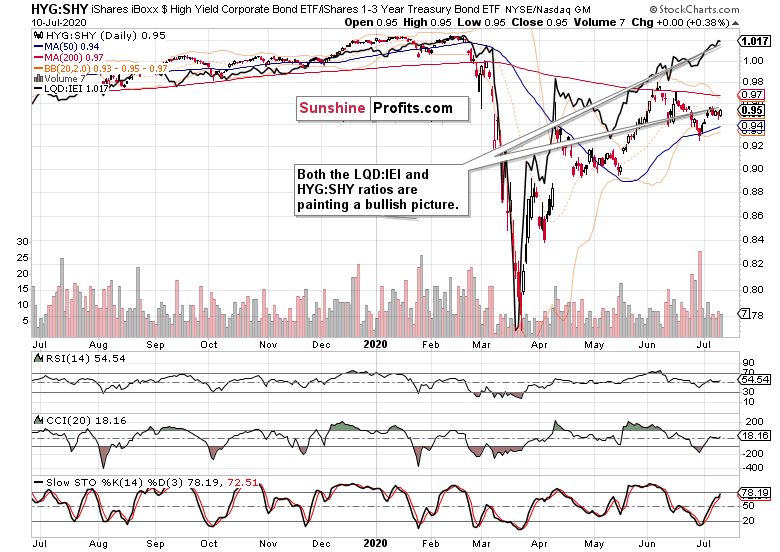
Both the high yield corporate bonds to short-term Treasuries (HYG:SHY) and investment grade corporate bonds to longer-dated Treasuries (LQD:IEI) are positioned supportively for the stock upswing to continue.
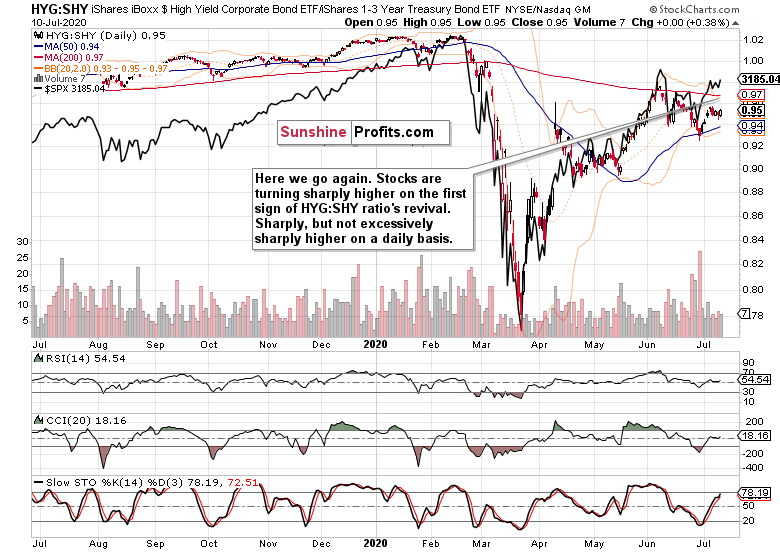
And as you can see on the HYG:SHY chart with the overlaid S&P 500 closing prices (black line), stocks aren't getting ahead of themselves any more dramatically since their late June upside reversal.
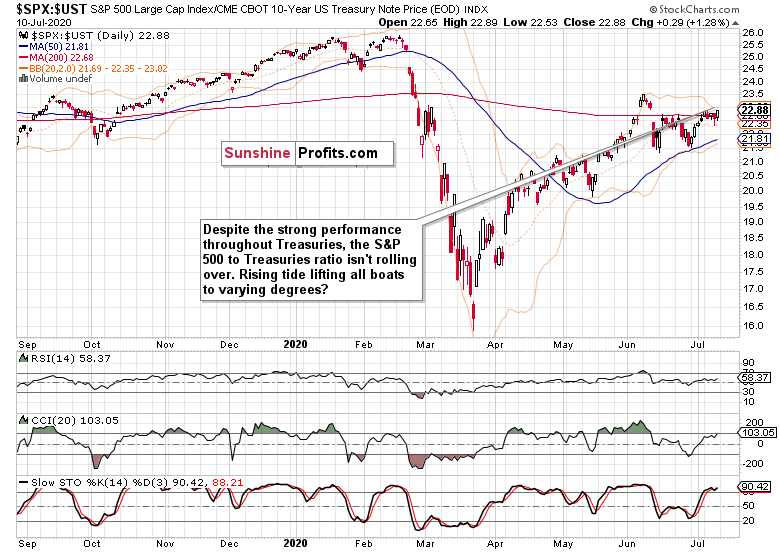
The stocks to Treasuries ratio ($SPX:$UST) isn't breaking down, far from it. Risk appetite is making a comeback into the market place, as the junk corporate bonds to all corporate bonds (PHB:$DJCB) ratio's unwillingness to decline any more in the short run is also hinting at.
As said on Friday, credit markets are telling me that the sky isn’t falling:
(…) should I see it start to, I'll change my mind and let you know about it. With the Fed waiting in the wings, the path of least resistance remains higher. And don't forget about the infrastructure bill or the second stimulus check either.
Some More on Stocks, USDX and Copper
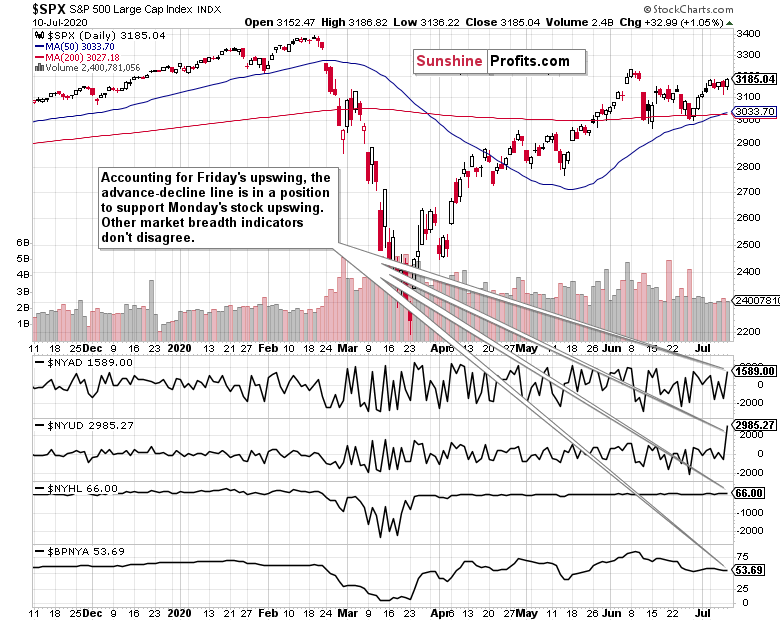
The daily market breadth indicators are still positioned constructively for the upswing to continue. They're not disagreeing or pointing to a changing character in the market. Yes, people might be looking suspiciously on liquidity-driven rallies, and the pace of money creation is truly unprecedented.
But such a rally can go on longer than thought. Equally so, the subsequent reversal might come in as really sharp. Do we see such froth currently? Not yet.
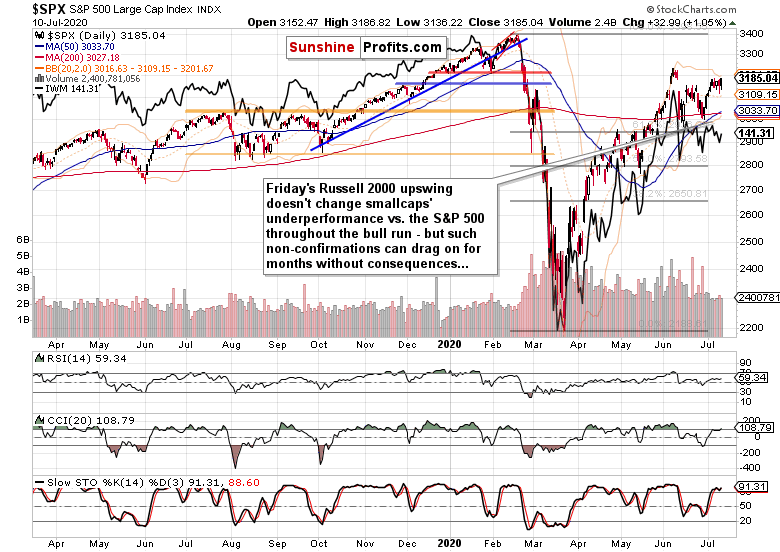
The Russell 2000 (IWM ETF) underperformance goes on, and Friday's upswing isn't a game changer. But such underperformance can go on for months while both indices march mostly higher, which is what I think comes next.
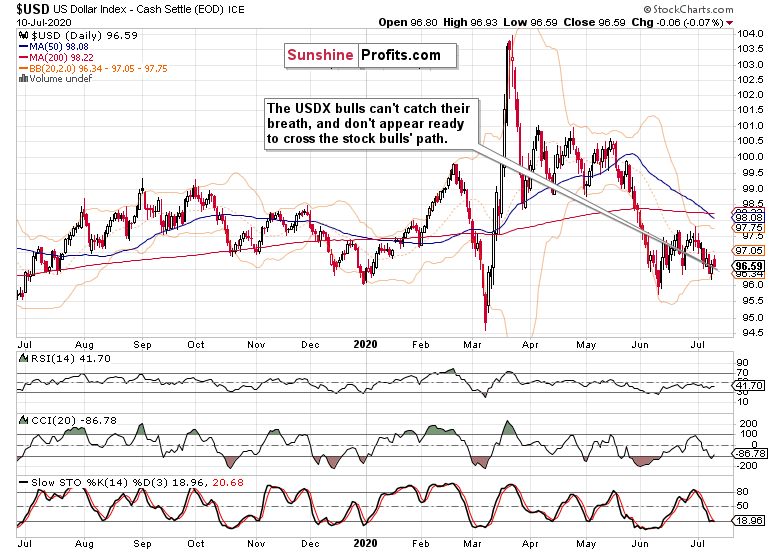
The greenback isn't flashing a warning sign of a deflationary squeeze ahead, and that's conducive for risk assets. Had I seen rising Treasuries, rising dollar, and wavering stocks – that would be a different cup of tea entirely.
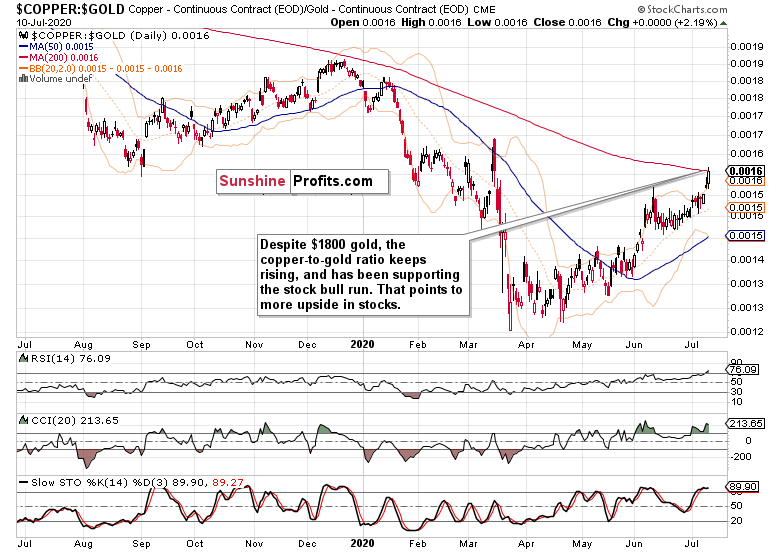
There is the China recovery, there are issues at copper-producing nations and mines. But gold is holding up greatly, and generally rising since the March liquidity crunch. Even as it's over $1800, copper is doing greatly too! Just as emerging markets (EEM ETF) are.
The copper-to-gold ratio has risen considerably. Does the red metal smell economic recovery fueled not merely by the electric car mandates? I think that the ratio's performance is a gentle nod in favor of the stock bull run to continue.
From the Readers' Mailbag
Q: First off. you're the reason I subscribed to Sunprofits, your team analysis are well thought through, it's just read and relax. Speaking of fundamentals, looking at Change in EPS vs Change in Price for Q2. Do we have to wait for a wave of bankruptcies before dot-crash II happens? Are the trends similar?
A: Thank you for the appreciation, it's great to know my analyses are helping you! P/E ratios as a prominent decision-making tool rise in prominence for long-term investors. As I seek to capture short- and medium-term moves, they're less useful on a daily basis. And the same goes for their quarterly comparison. As I wrote recently, it's the P in P/E that counts for more, which in other words means that it's about the price charts.
Bubbles can go on for longer than most people think, and the same is true for the current Fed-has-our-back one. Corporate bankruptcies are rising already, yet the S&P 500 marches higher regardless of most stocks trading below their 200-day moving averages. It's hard to say what would be the catalyst, the pin if you will, that will prick the current stellar rise off the March 23 lows. It might coincide, precede, or lag behind the anticipated wave of bankruptcies you mention – and of course, it depends upon how one defines a wave exactly.
But this pricking doesn't need to happen in Q2. I still think that we'll take on the S&P 500 Feb highs this year, and stand a good chance of overcoming them before 2020 is over.
Summary
Summing up, Friday's upside reversal is giving the stock bulls the anticipated upper hand in the short-run, which is in line with the medium-term assessment too, Credit markets are supporting the stock upswing, and appear likely to do so even more in the near future. The Russell 2000 underperformance is amply outweighed by the S&P 500 market breadth, dollar's weakness and surging emerging markets and copper. The breakout above the short-term resistance formed by the mid-June S&P 500 tops has thus good prospects of succeeding shortly.
I encourage you to sign up for our daily newsletter - it's free and if you don't like it, you can unsubscribe with just 2 clicks. If you sign up today, you'll also get 7 days of free access to the premium daily Stock Trading Alerts as well as our other Alerts. Sign up for the free newsletter today!
Monica Kingsley
Stock Trading Strategist
Sunshine Profits: Analysis. Care. Profits.
* * * * *
All essays, research and information found above represent analyses and opinions of Monica Kingsley and Sunshine Profits' associates only. As such, it may prove wrong and be subject to change without notice. Opinions and analyses were based on data available to authors of respective essays at the time of writing. Although the information provided above is based on careful research and sources that are believed to be accurate, Monica Kingsley and her associates do not guarantee the accuracy or thoroughness of the data or information reported. The opinions published above are neither an offer nor a recommendation to purchase or sell any securities. Ms. Kingsley is not a Registered Securities Advisor. By reading Monica Kingsley’s reports you fully agree that she will not be held responsible or liable for any decisions you make regarding any information provided in these reports. Investing, trading and speculation in any financial markets may involve high risk of loss. Monica Kingsley, Sunshine Profits' employees and affiliates as well as members of their families may have a short or long position in any securities, including those mentioned in any of the reports or essays, and may make additional purchases and/or sales of those securities without notice.
*********

Monica Kingsley is a trader and financial markets analyst. Checking dozens of charts daily, she integrates their messages with economics and in-depth experience. Trade calls and writing are her cup of tea as much as studies in market histories. Having been at the financial markets when the Great Recession arrived, she experienced many bull and bear markets - be it in stocks, bonds, gold and silver. https://www.monicakingsley.co
More from Silver Phoenix 500


