Can The Efforts To Turn S&P500 Around Really Stick?


While Friday’s session turned out kind of undecided, it was still a down session with the bears bringing home the bacon. Can the same conclusion be reached when examining the weekly chart? And what about other valuable clues as to the upcoming S&P500 move?
Let’s start today’s analysis with the weekly chart examination (charts courtesy of http://stockcharts.com).
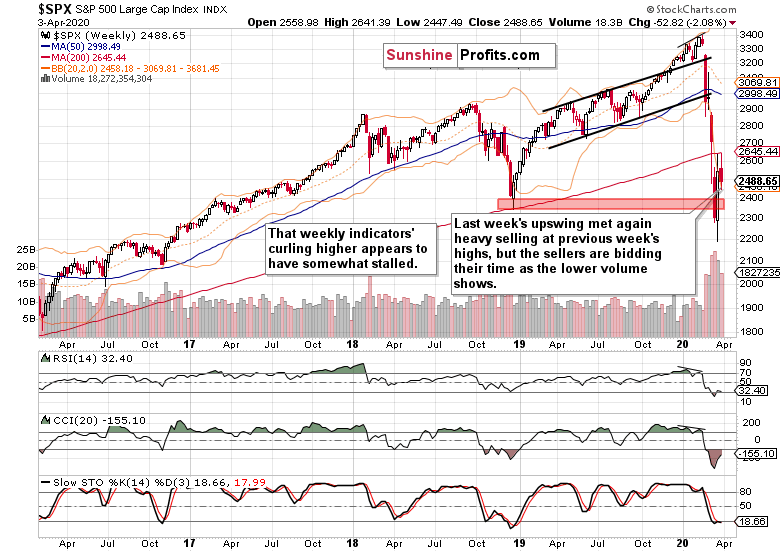
These were our last Monday’s weekly comments:
(…) Prices invalidated their breakdown below the red support zone marked by the December 2018 lows. But this invalidation was marked by lower volume compared to the preceding breakdown, and was also accompanied by the bulls giving up a sizable part of their weekly – not to mention last Monday’s push lower, which created a comparably large lower knot.
This points to the conclusion that the breakdown invalidation is far from a foregone conclusion. This is also supported by the weekly indicators still leaning bearish – regardless of the Stochastics buy signal or the RSI leaving the oversold territory.
The latest weekly candle shows that the upswing attempt was rejected and prices declined again. Weekly indicators still remain in bearish territory, and their curling higher has run into stiff headwinds. There is one cautionary sign for the bears though. It is the lower volume of the downswing when compared against the preceding upswing’ one. This can either mark a normal pause in the continuing downswing, or herald a move higher.
Let’s take a look at the daily chart to see which one of these possibilities is more likely.
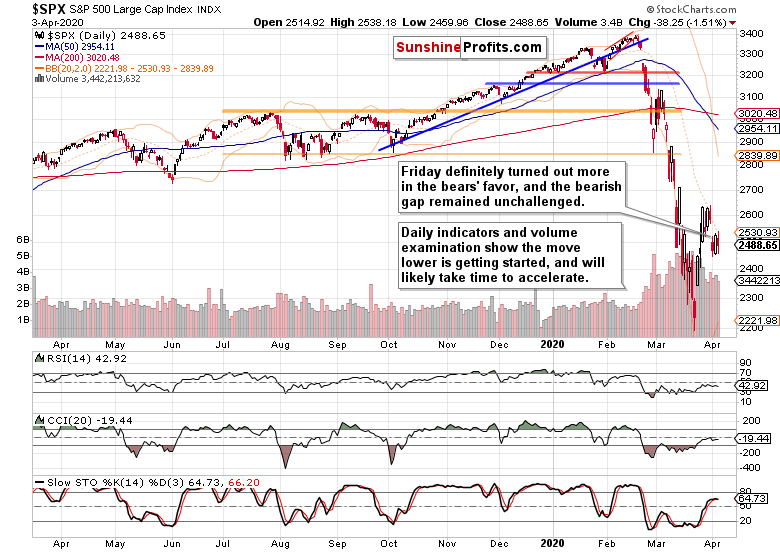
These were our Friday’s observations:
(…) After Thursday’s session, the daily indicators are overall positioned more bearishly than the day before, lending credibility to the claim of yesterday’s session being merely a pause in the downswing. The bearish gap continues to support the sellers, and we certainly expect the downside move to continue over the coming days.
The daily indicators’ positioning hasn’t changed on Friday, and Wednesday’s bearish gap survived Friday unchallenged. While a bit smaller than in the days before, volume behind the downswing hasn’t dried up.
How does that combine with the overnight upswing that took S&P 500 futures over 2585?
Let’s take a good look at the debt markets to assess what the stock rally is made of.
We’ll start with the high-yield corporate debt (HYG ETF). Its encouraging slide on Friday made us expect further pressure on stock prices. This is a quote from a recent alert, which we issued after the regular Stock Trading Alert was published:
(…) Stocks are holding up relatively well while HYG is having a bad day, trading below 73.80.
And that’s how Friday’s session finished in HYG.
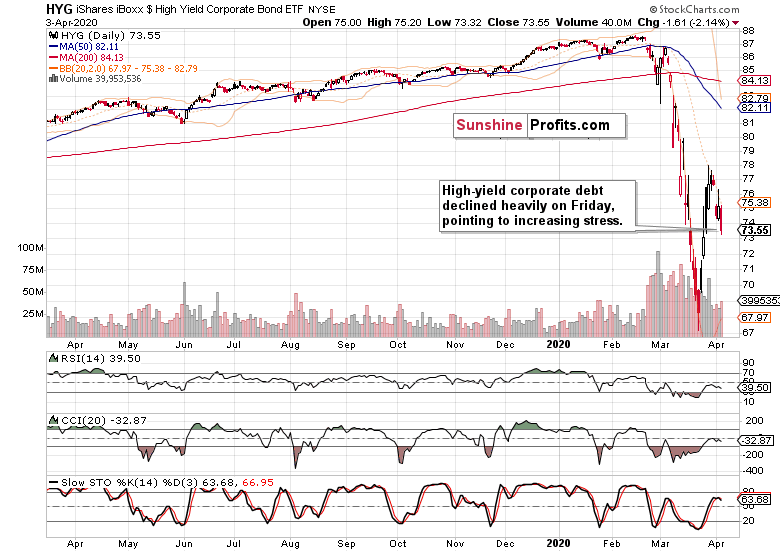
Closing near the daily lows, and on increased volume. Daily indicators are bearishly positioned, supporting more downside.
We should point out that high-yield corporate debt doesn’t (yet) belong among the asset classes eligible for Fed buying. This can’t be said about municipal bonds though. Let’s check the HYD ETF then.
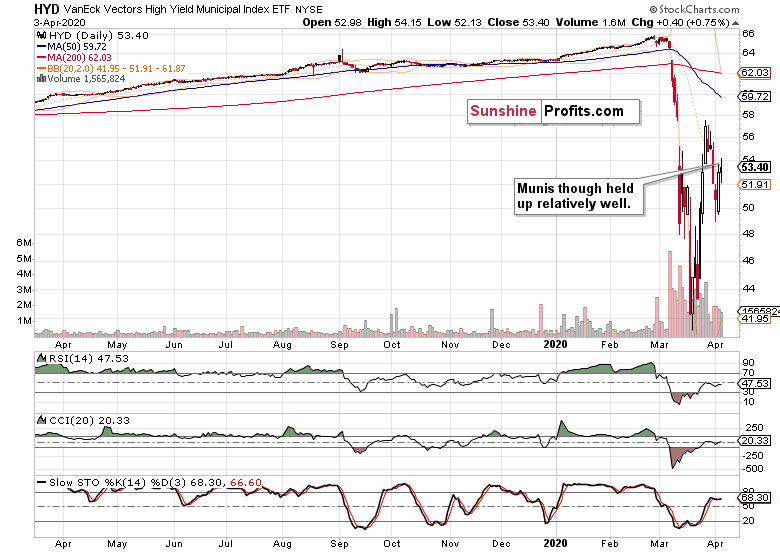
Yes, they declined last week too, but have been rising on Thursday and Friday. Does it mark an attempt to front-run the Fed, and bid up munis just before they stuff them on their balance sheet? One can’t get rid of the nagging feeling that these too show persisting signs of stress despite their direct support by the Fed.
And what about emerging markets government bonds? These must surely be asset classes directly unsupported by the Fed. Let’s see how their local central banks with all the currency swaps at their disposal, are doing in the battle against the deflationary coronavirus implications.
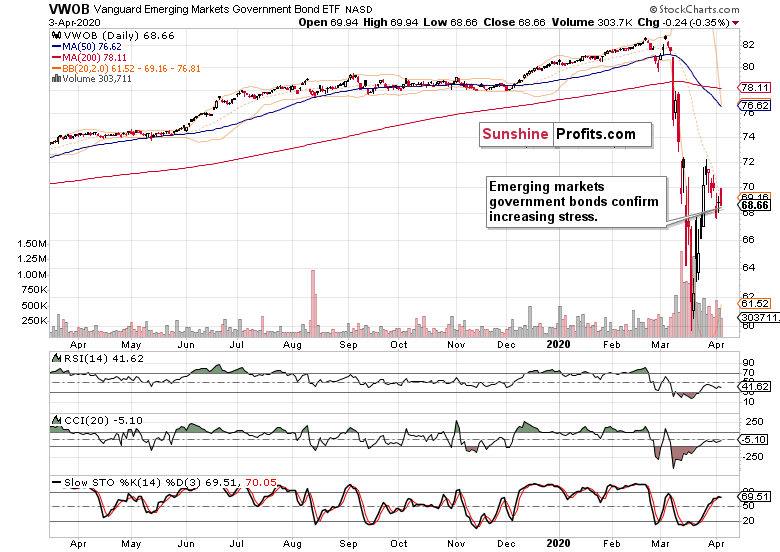
That’s sort of a middle ground – these too had a down week but didn’t close at the weekly lows. Still, the signs of stress are evident in this chart as well. One could come to similar conclusions from looking at the dynamics in the LIBOR/OIS spread, TED spread, or various credit default swaps, too. Rising spreads show that liquidity is being withdrawn from the system, which is a bearish leading indicator for stocks. Falling Treasury yields send the same message.
As a result, stocks aren’t out of the woods yet, not by a long shot. We expect the return of the bears despite the improvement in coronavirus death counts over the weekend that came in from NYC, Spain or Italy. The pain, its recognition and economy restart will be a time-consuming process and not a one-way road.
Summing up, the bears enjoy the upper hand as can be seen on both the weekly and daily charts. Despite the overnight upswing in the futures, stocks don’t appear out of the woods just yet. While bidding their time, the sellers are highly likely to become active at the nearest opportunity. The daily indicators, high-yield corporate debt market and fundamental prospects of more coronavirus pain and its reflection in market prices mean that our open short position remains justified.
We encourage you to sign up for our daily newsletter - it's free and if you don't like it, you can unsubscribe with just 2 clicks. If you sign up today, you'll also get 7 days of free access to our premium daily Stock Trading Alerts as well as our other Alerts. Sign up for the free newsletter today!
Monica Kingsley
Stock Trading Strategist
Sunshine Profits - Effective Investments through Diligence and Care
* * * * *
All essays, research and information found above represent analyses and opinions of Przemyslaw Radomski, CFA and Sunshine Profits' associates only. As such, it may prove wrong and be subject to change without notice. Opinions and analyses were based on data available to authors of respective essays at the time of writing. Although the information provided above is based on careful research and sources that are believed to be accurate, Przemyslaw Radomski, CFA and his associates do not guarantee the accuracy or thoroughness of the data or information reported. The opinions published above are neither an offer nor a recommendation to purchase or sell any securities. Mr. Radomski is not a Registered Securities Advisor. By reading Przemyslaw Radomski's, CFA reports you fully agree that he will not be held responsible or liable for any decisions you make regarding any information provided in these reports. Investing, trading and speculation in any financial markets may involve high risk of loss. Przemyslaw Radomski, CFA, Sunshine Profits' employees and affiliates as well as members of their families may have a short or long position in any securities, including those mentioned in any of the reports or essays, and may make additional purchases and/or sales of those securities without notice.
********

Monica Kingsley is a trader and financial markets analyst. Checking dozens of charts daily, she integrates their messages with economics and in-depth experience. Trade calls and writing are her cup of tea as much as studies in market histories. Having been at the financial markets when the Great Recession arrived, she experienced many bull and bear markets - be it in stocks, bonds, gold and silver. https://www.monicakingsley.co
More from Silver Phoenix 500


