Comprehensive Chartology Of Silver Price


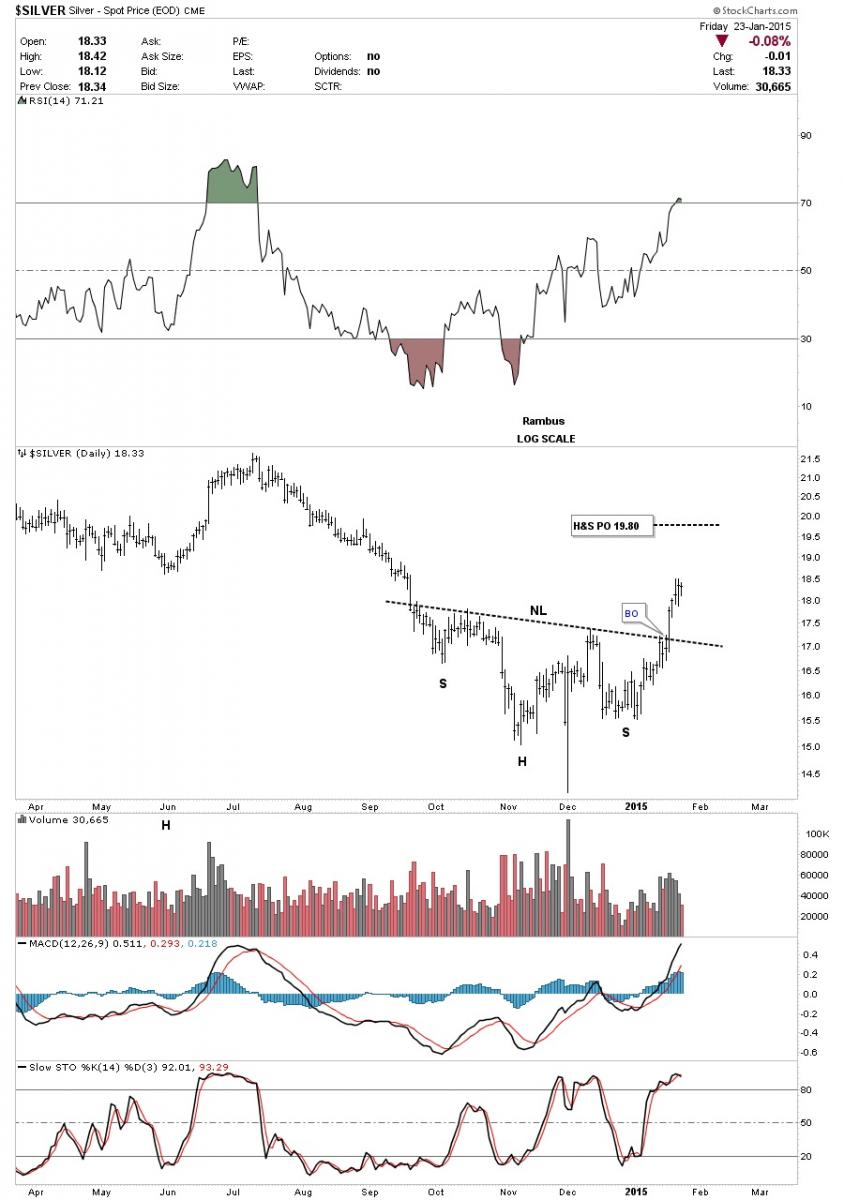
Five days ago silver broke out of an inverse H&S bottom that has temporarily reversed the downtrend. I measured the more conservative price objective using the higher low instead of the Swiss spike low which comes in around the 19.80 area on the log chart. It will be interesting to see if the Swiss spike low will be the ultimate low for the bear market or just a short to intermediate low. Sometimes big trends can end with one last shake out of the weak hands similar to the Swiss spike low.
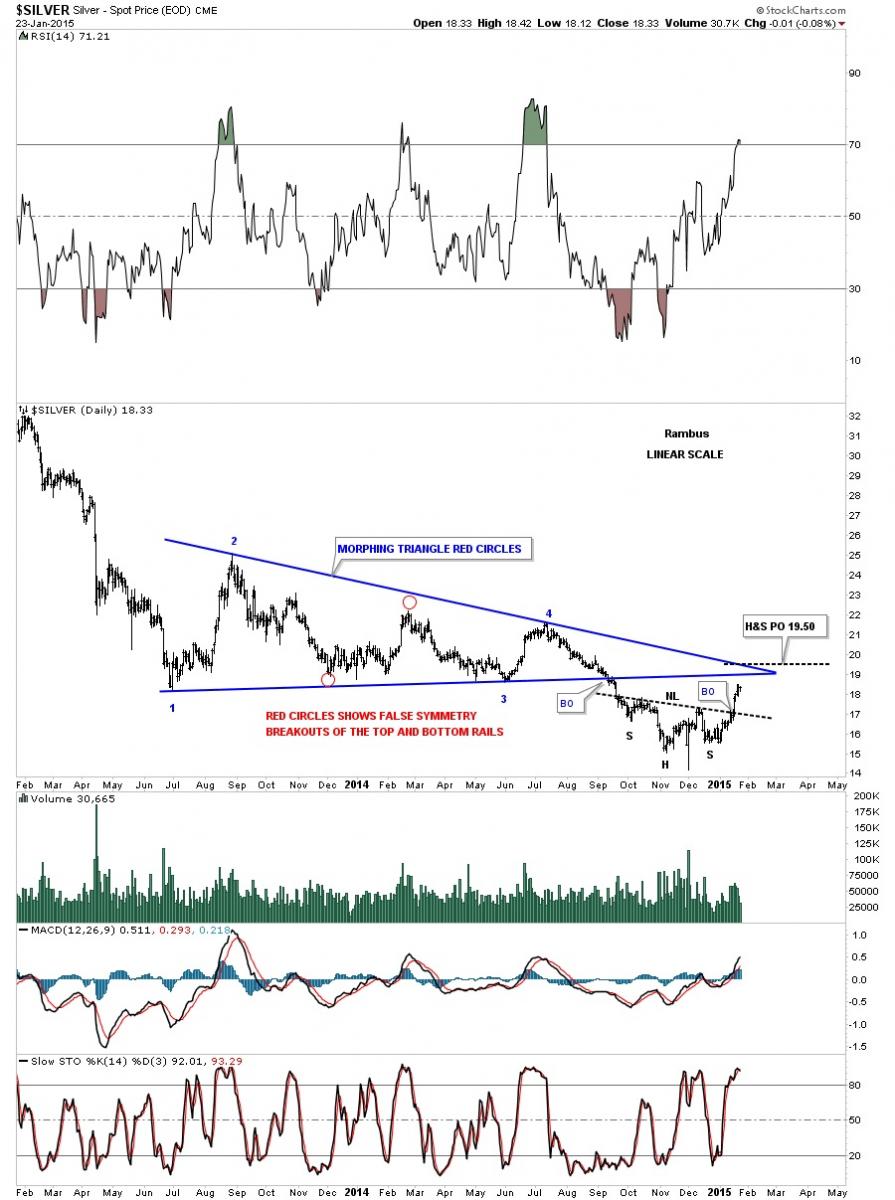
Below is a two year chart for silver that shows its big triangle consolidation pattern that did a little morphing before it finally broke down in September of last year as shown by the red circles. Since the breakout silver has built out an inverse H&S bottom and is now in rally mode. As you can see on the chart below silver is approaching two very important trendlines from the big blue triangle consolidation pattern. The price objective of that inverse H&S bottom comes in around the 19.50 area which is slightly above the apex. One thing we need to keep in mind is that the inverse H&S bottom is a reversal pattern that can reverse a downtrend. It’s way too early yet to think about a reversal of the bear market but if silver can ever trade above the apex of the blue triangle that would be the first step in the right direction.
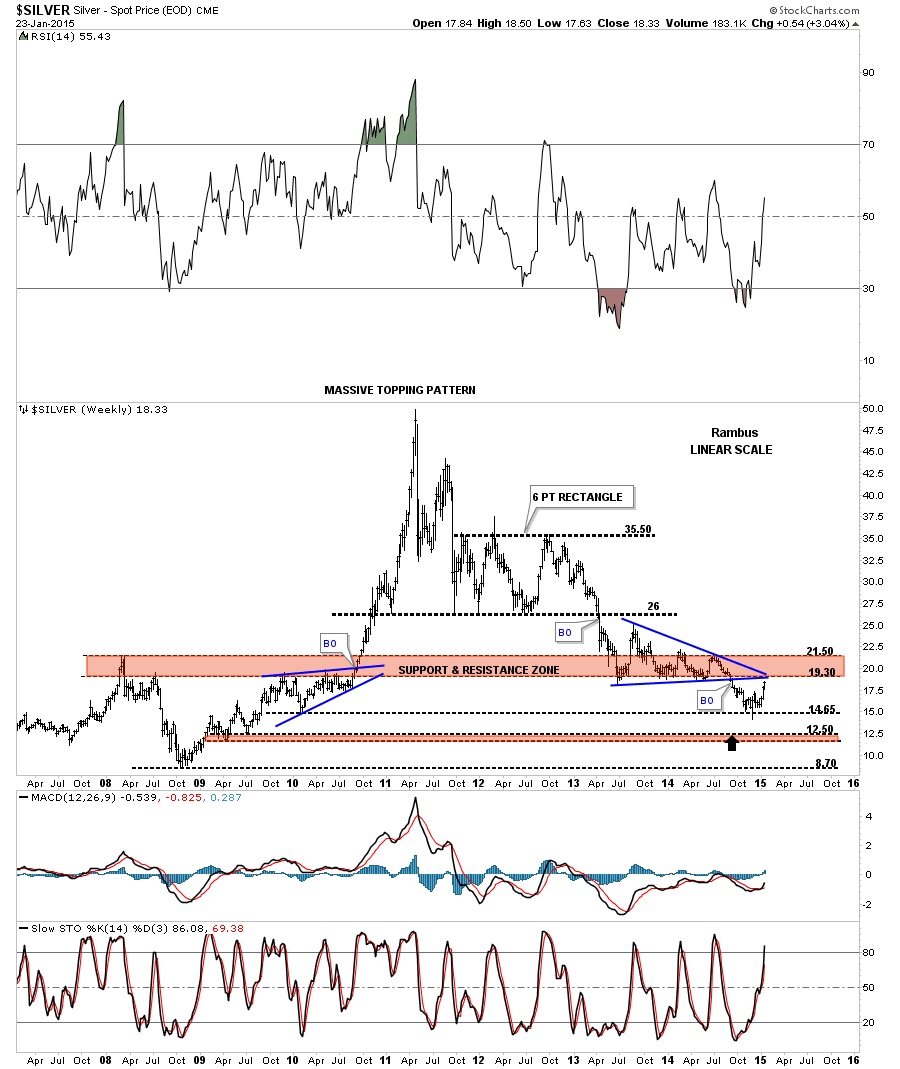
This long term weekly chart for silver shows it bouncing off of the next lower support line at 14.65 with the Swiss spike low. Now it’s entering into the brown shaded support and resistance zone which is just over head. Bottom line is silver has to have more buyers than sellers to overcome which looks like strong resistance overhead.
This next long term weekly chart for silver shows the parabolic rally phase into the April 2011 top which ended the bull market. From the bull market top silver has been trading in a parallel down trend channel for almost four years now which is a pretty lengthy move in one direction. Again it’s up to the bulls to reverse this downtrend channel in a similar fashion to the way they did back in 2008 crash low. You can see the price objective to the 50 area in 2011 using two different patterns. The inverse H&S bottom had a price target up to 45.75 and the red expanding triangle halfway pattern had a price objective up to 50. Impulse moves like that are mush easier to trade than these big 18 month consolidation patterns.
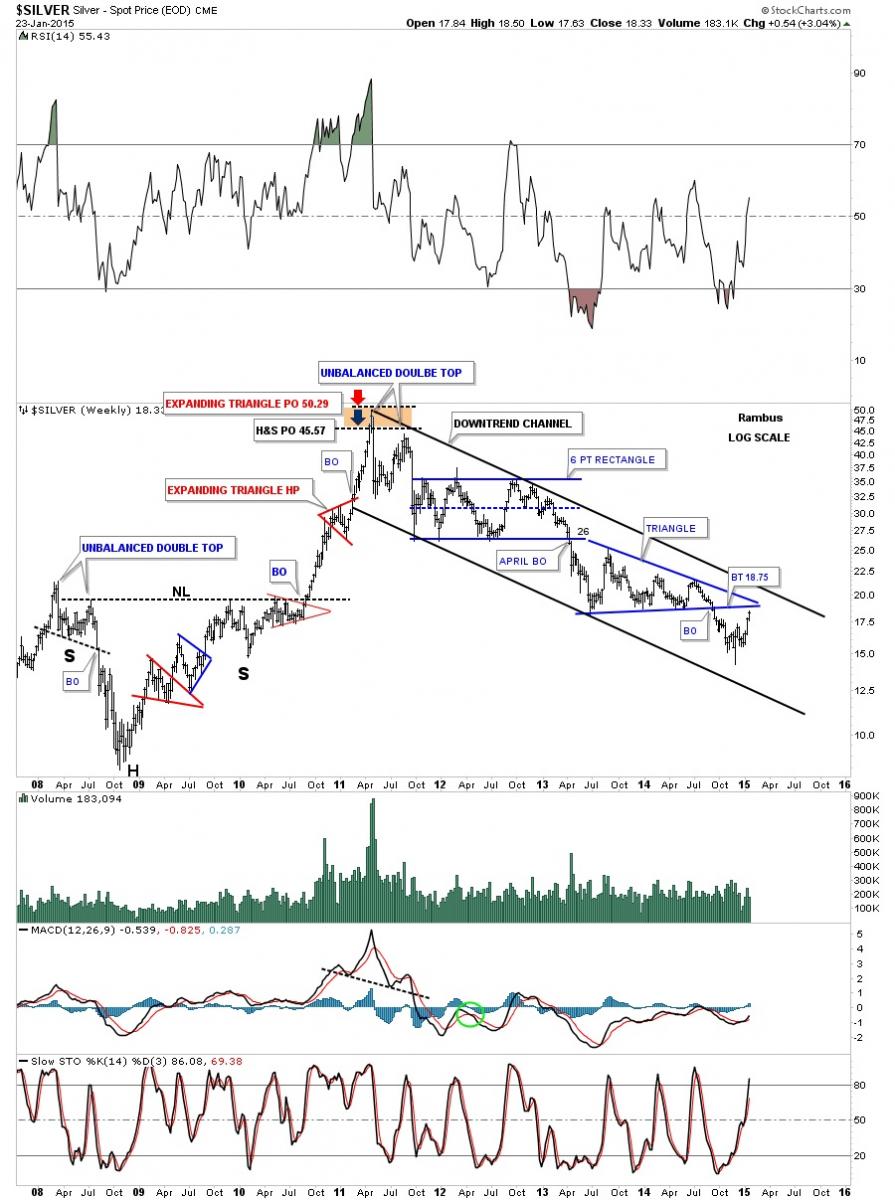
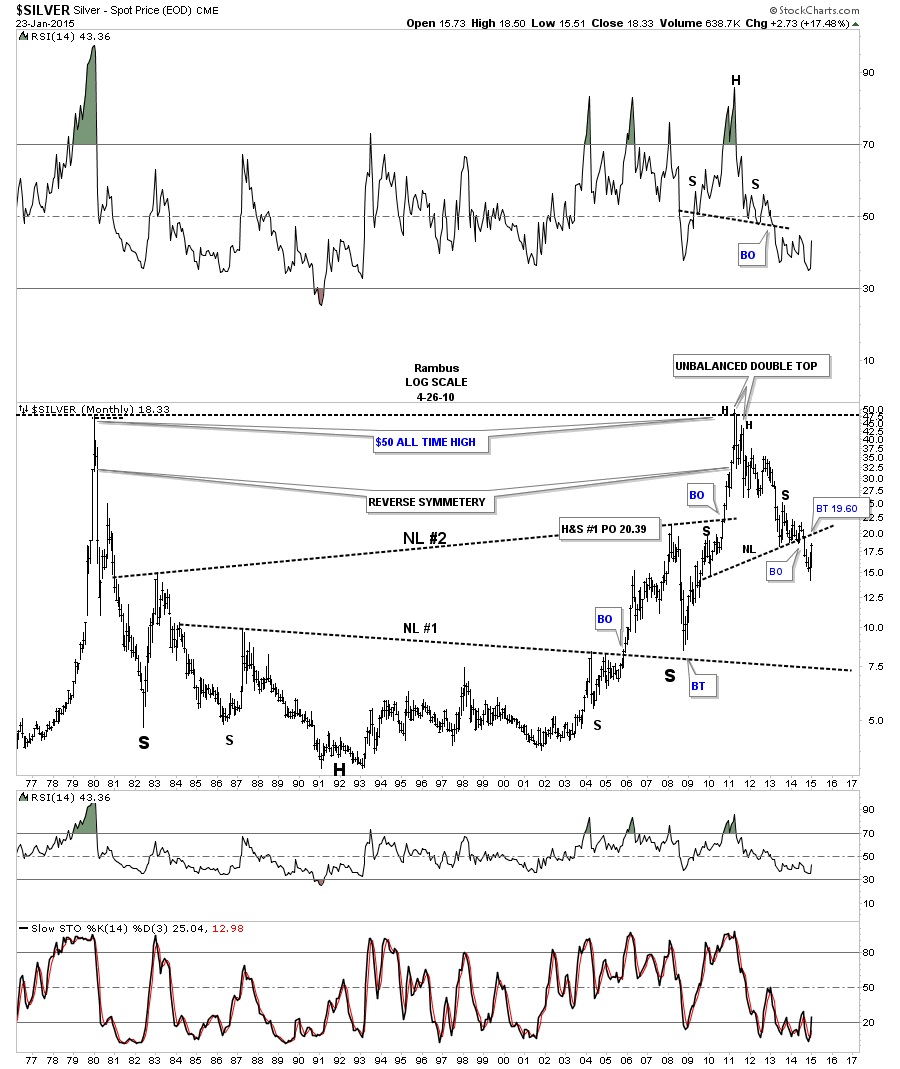
This last chart for silver is a 40 year look that shows its bull market top in 1980 and the decline that followed and the long drawn out sideways trading range that went on for many years. There is actually some very nice symmetry on the left and right side of the chart as shown by the big necklines. We’ve been following a potential very large H&S top where the price action broke below the neckline about six months ago. It’s now attempting to backtest the neckline to the 19.60 area which will be critical resistance. At least you have some perspective of where silver was in the past and how it relates to the present which is important to know.
In the Weekend Report we’ll take a good hard look at some of the Kamikaze stocks to try and gain some insight on what is taking place right now with these volatile stocks. All the best…Rambus
Courtesy of rambus1.com
 Rambus Chartology is Primarily a Goldbug TA Site following the precious metals markets. Chartology is the Unique Blend of Technical Chart Pattern Identification and Market Psychology, Developed by Rambus During the Tech Mania of the late 1990s. His Early Training came the old fashioned way...Reading Edwards and McGee's Bible of Technical Analysis and spending years with a sharp pencil graph paper and ruler refining his skills and accuracy. Visit the Rambus Chartology website at http://rambus1.com/.
More from Silver Phoenix 500


