This Comprehensive Research on the Gold/Silver Ratio Gives Us a Big Fat Hint About What’s Ahead


I know silver investors are discouraged. The price action doesn’t reflect what we think it should, particularly when inflation’s been spiking.
There are valid reasons for the lag in price—a soaring US dollar, a perceived drop in industrial demand from recession or stagflation fears, a crashing stock market forcing investors to liquidate other holdings—but those don’t make us feel any better.
I think one of Mike Maloney’s strengths is that he views trends through the lens of history. As he’s said many times, the further you look in the past, the further you can see into the future.
I decided to employ that strategy with the gold/silver ratio, to examine how silver has performed during its biggest declines over the past 50 years, to give us some insight into what it might do in the next decline. As any silver investor knows, a drop in the ratio means silver is outperforming gold—I wanted to see just how much.
I found the results of this research interesting. See what you think…
Silver’s Gains During Sharp Drops in the Gold/Silver Ratio
I went back to the early 1970s and logged all major declines in the gold/silver ratio, highlighting each period in a green bar. I then listed:
- The percent drop in the ratio
- Gold’s performance
- Silver’s performance
There have been many big drops in the ratio over the past five decades (I excluded smaller or longer periods).
Here’s the first period, from 1973 to 1997, which includes both bull and bear markets in silver. The chart’s a tad crowded, but I wanted to provide all the information for each period.
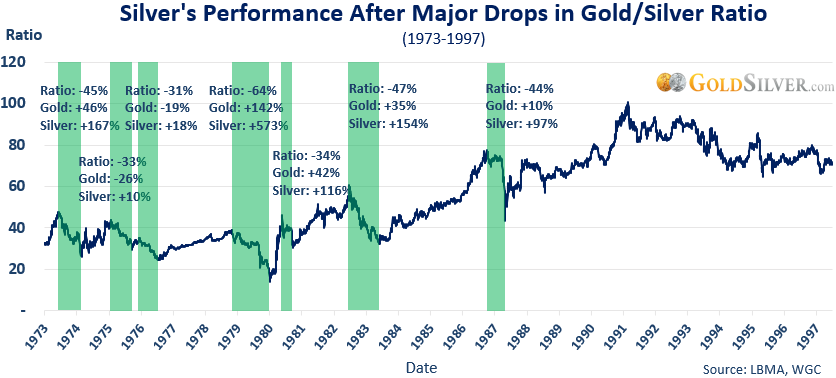
You’ll notice that of the seven sharp drops in the ratio, silver gained triple digits in four of them, and 97% in a fifth one. Only in two did it log a small gain. It’s also noteworthy that the 1983 and 1987 periods occurred during bear markets.
Silver’s biggest performance was 1979 to 1980, during its blowoff move to the all-time high of $50, where the ratio fell from 40 to 17 in one year.
Here are the sharp drops from 1997 to present.
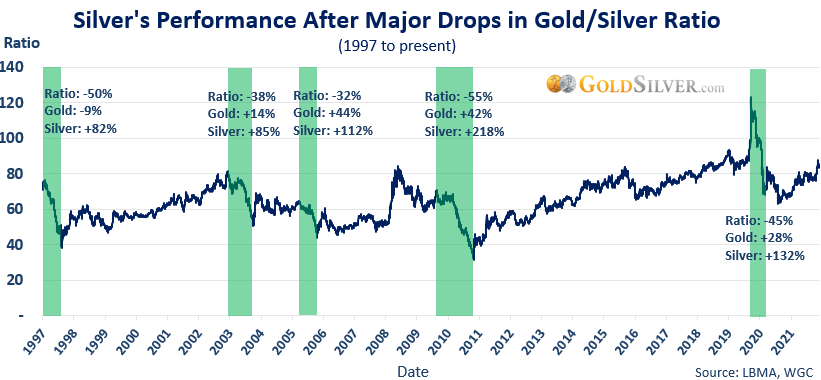
Of the five major declines in the gold/silver ratio, the silver price gained triple digits in three of them, and 80%+ gains in the other two.
The biggest outperformance was in 2011, leading up to its blowoff top to the $49 range, where the ratio fell from 70 to 32.
There’s another message in this data…
There have been 12 major declines in the gold/silver ratio over the past 50 years (along with a bunch of smaller ones). This historical record, on its own, suggests another one is virtually inevitable. It may not feel like it at the moment, but I’ll bet a lot of silver investors have felt that way before—right before it suddenly took off again. And this is without considering the monetary shifts that Mike has talked a lot about, which haven’t really kicked into high gear yet.
Is a triple-digit gain ahead for silver?
That’s what happened in almost every past bull market when the ratio dropped sharply. The next green bar could be very interesting.
Our job is to stay vigilant, and prepared, for the next spike in the silver price.
********
More from Silver Phoenix 500


