Concern For ‘Stonks’


Last week, a former high-ranking Fed official disclosed that the Fed is determined to "break" the stock market. If they succeed in this, the impacts will be felt across all markets, so maybe we should take him seriously?
Let's begin with the former head of the New York Fed, Bill Dudley. In an interview last week, Dudley stated this:
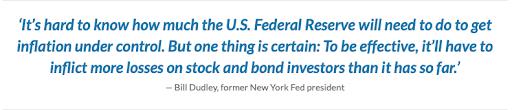
The Fed's goal, according to Dudley, is to engineer a reverse wealth effect whereby a crashing stock market reduces overall demand for goods, and as such, this demand reduction will help the Fed to get inflation under control. Fed must ‘inflict more losses’ on stock-market investors to tame inflation, says former central banker.
Now keep in mind, these vainglorious central bankers are the same fools who have claimed for the past twelve months that inflation was "transitory". If they can be so dead wrong about the causes of inflation, how and why would anyone expect them to get the fix for inflation correct? And how and why would anyone believe that they can successfully rig the stock market lower?
But I suppose that's beside the point. Instead, the U.S. Federal Reserve is now openly warning you that they are going to hike their fed funds rate as many times as they feel necessary to control inflation, the stock market be damned.
So, will this actually play out? Will the Fed run fed funds to over 3.00% or higher? Or instead, will Powell chicken out as he did in December of 2018? Those are the questions you need to ask yourself.
With this in mind, let's go back to 2018 and review what happened back then—for, as is often the case when dealing with central bankers, past is prologue.
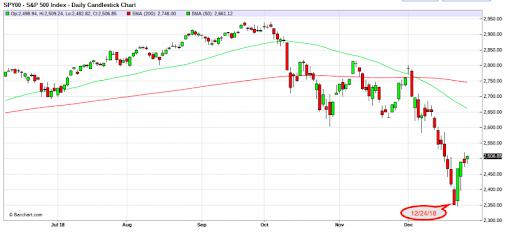
As the year 2018 drew to a close, the situation was somewhat similar to present day. Bank analysts and economists were projecting multiple rate hikes in the months ahead. The Fed had been gradually raising interest rates and slowly drawing down their balance sheet for a few years, but the market had reached a breaking point in terms of liquidity. Below is a chart of the S&P 500 from the second half of 2018.
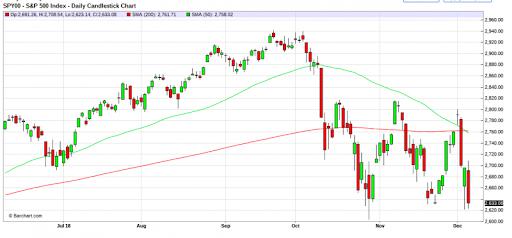
Here's what you need to note on that chart:
-
The bull market had been riding higher along with its 50- and 200-day moving averages.
-
Once it rolled over and broke down through both, it fell about 10%.
-
It then began a consolidation or flag with key support near the 2600 level.
OK, with that in mind, now take a look at the current chart of the S&P:
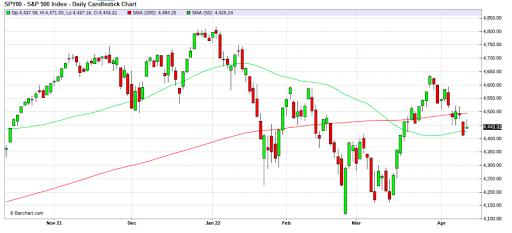
What do you see? How about:
-
1. The bull market had been riding higher along with its 50- and 200-day moving averages.
-
4. Once it rolled over and broke down through both, it fell about 15%.
-
5. It then began a consolidation or flag with key support near the 4100 level.
So now, here's where it gets interesting...
In December 2018, the S&P crashed through support at 2600 and then fell about 10% in 10 days. An emergency meeting of The President's Working Group on Financial Markets was convened on Christmas Eve. The Powell Pivot away from tightening was instituted, and after being closed for Christmas, the stock market began its recovery on December 26. There would be no rate hikes in 2019, and instead, The Fed began a regime of fed funds rate cuts at its FOMC meeting in June of that year.
The old adage states that history doesn't repeat...but you can certainly see where this is all starting to rhyme. Just like late 2018, the stock market has begun to fall in anticipation of reduced liquidity and higher interest rates. Analysts are unanimously stating that there will be at least 200 basis points of fed funds rate hikes in 2022. And now, we have former high-ranking Fed officials stating that it's the Fed's goal to "break" the stock market.
Maybe we had better start preparing for some serious pain in the global equity markets because if the S&P falls, it's likely taking everything else with it.
So, how far might the S&P fall before Powell is forced to step in again and reverse course? For that answer, let's look again at a chart. This time, though, let's look at the weekly chart so that we can see 2018, 2020, and 2022 all in one.
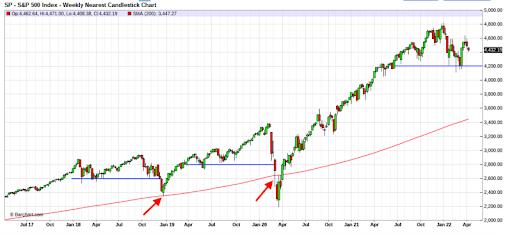
What should you notice?
-
1. In December 2018, the S&P broke support at 2600 and proceeded to fall 10% to 2350 and the 200-week moving average. At this point, Powell stepped in with his "Powell Pivot".
-
6. In March 2020, the S&P broke support at 2800 and proceeded to fall 21%, well below its 200-week moving average. Powell stepped in and unleashed "QE∞" on March 23.
So, it would certainly seem that IF/WHEN the S&P 500 takes out support at 4100 in the weeks ahead, the target would be a 15% drop to the 200-week near 3500. At that point, history would strongly suggest that Powell will step in with another "pivot".
As such, the point of this post is to get you to ask yourself if you are prepared for this eventuality. What would a drop in the S&P to 3500 do to your 401(k), RRSP, or IRA? And what would be the impact on all other markets? How would your mining shares react? What about COMEX precious metal prices?
Again, maybe I'm wrong. The Fed has blundered nearly everything else they've attempted over the past decade, and this latest round of tightening designed to squash inflation may fail as well. But they're plainly telling you that they're going to try this tactic, so you'd better prepare now for the likely impacts. As Benjamin Franklin famously stated, forewarned is forearmed.
************

Craig Hemke began his career in financial services in 1990 but retired in 2008 to focus on family and entrepreneurial opportunities. Since 2010, he has been the editor and publisher of the TF Metals Report found at TFMetalsReport.com, an online community for precious metal investors.


