Currencies & Commentary


 In light of the news from the land of the rising sun and the sinking currency, let’s reserve NFTRH 315’s only real charting for a big picture monthly view of currencies, to which we usually give just a brief update, and then some misc. big picture monthly charts [not included in this excerpt] as we try to gain perspective on things that may seem illogical to our rational minds.
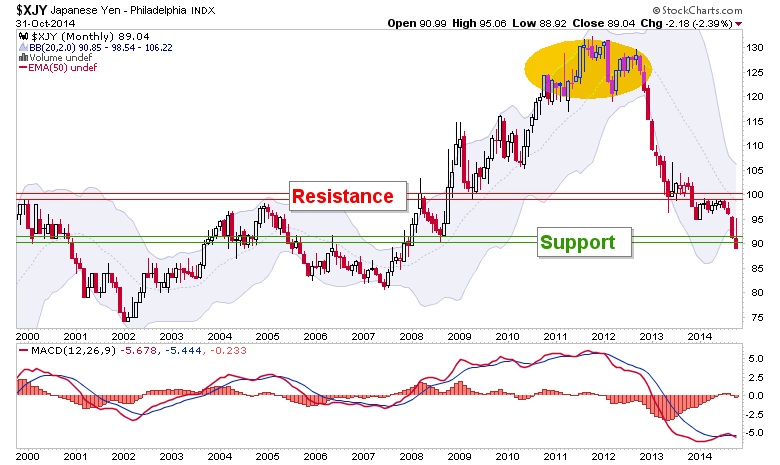
Yen is losing the next level of support. BoJ saw that support too. I’ll bet they also took note of the big October bounce and found it unacceptable.
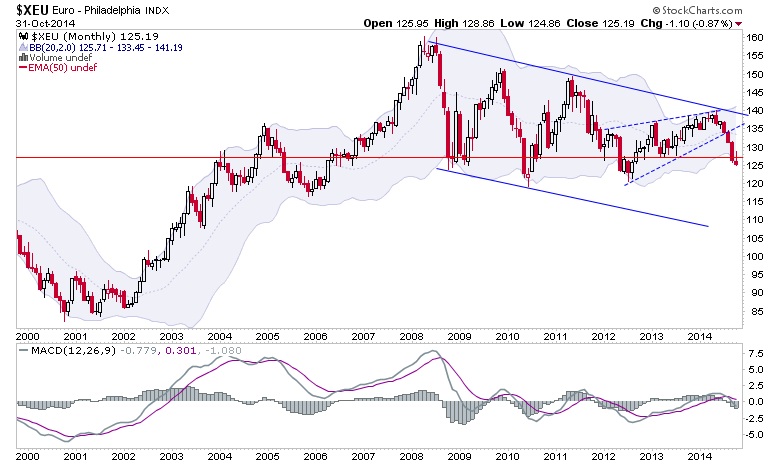
The Euro is losing the support zone after bouncing above it in-month.
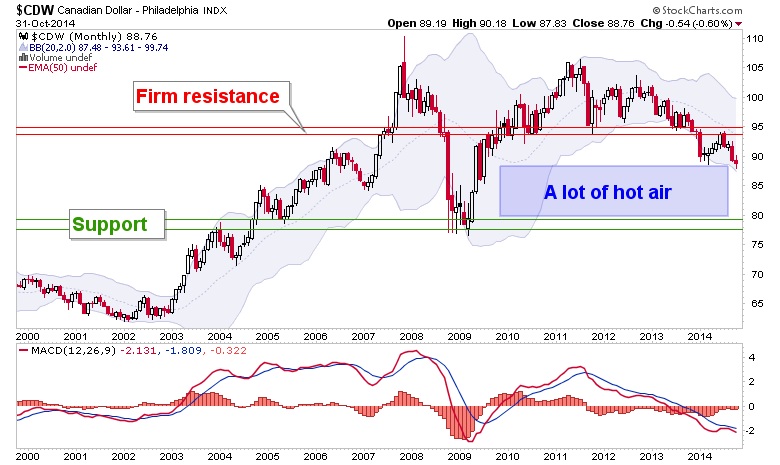
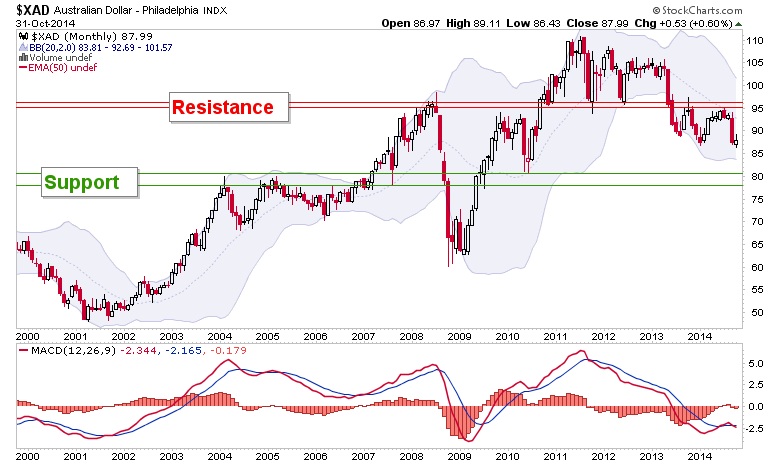
Commodity currencies [Canada & Aussie Dollars] have done nothing… except remain bearish as they have been for the better part of the last 2 years.
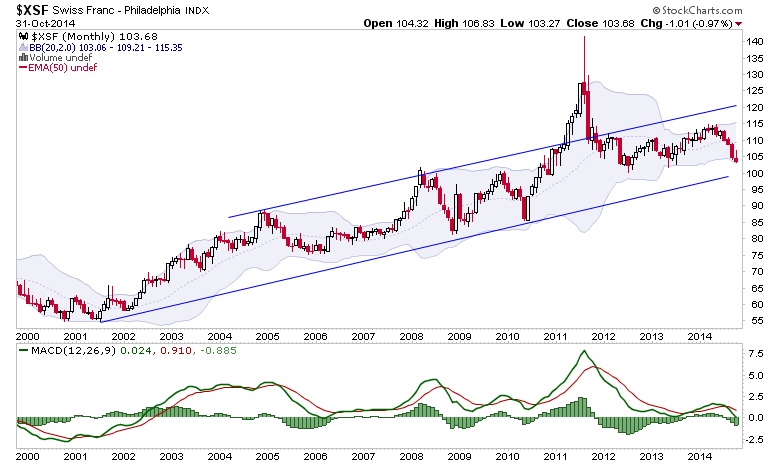
Swiss Francs continue to amble along, going nowhere with a long-term upward bias.
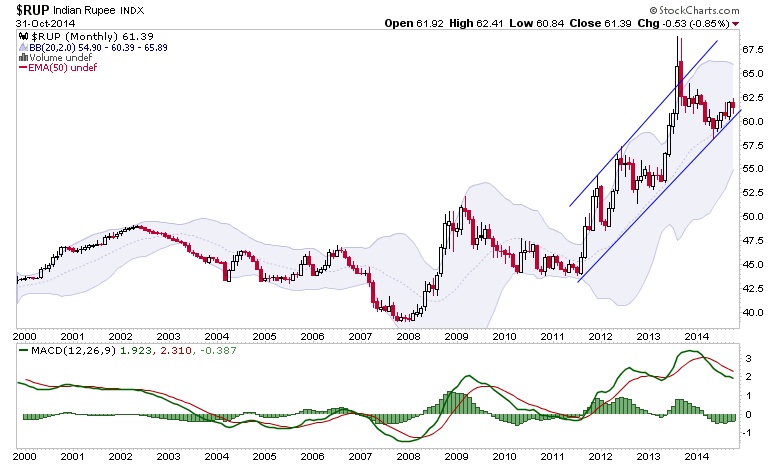
Indian Rupee continues in its uptrend channel with a ‘just right’ oversight from its Central Banker; you know, the sane one.
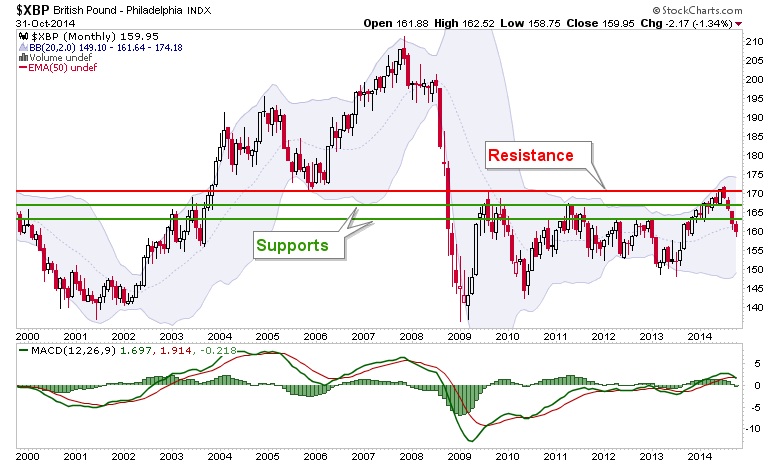
The British Pound has now lost both support levels. In other words, those are now resistance and should be colored red the next time you see this chart.
Finally ladies and gentlemen, I give you Uncle Buck. He of the most powerful country on earth.
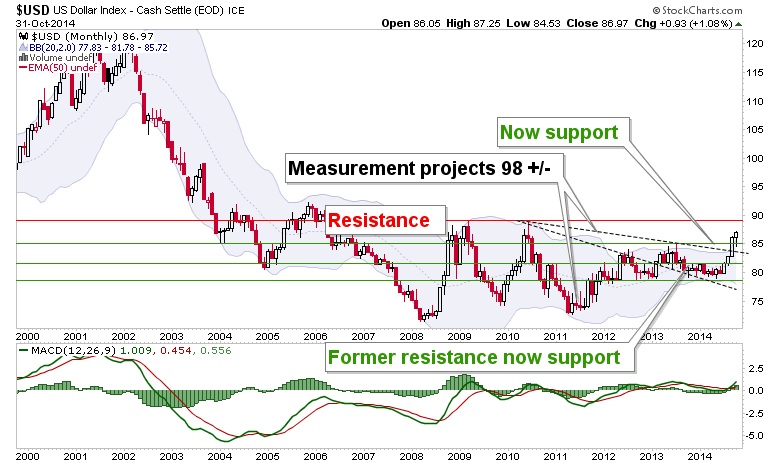
Alan Greenspan showed the world how it was done early last decade and he used the strength in USD to leverage an inflationary policy that lifted the US stock markets but lifted gold much higher. This gave rise to the famed Dow-Gold ratio along with other indicators that put the lie to his inflationary operation as being anything other than a macro parlor trick doomed to failure.
Then what happened in 2007? It began to fail. In 2008 it finally fell apart and from that destruction this new thing was built. This letter writer would be lying through his teeth if he tried to tell intelligent readers that he knew how it all worked, what its ultimate strengths and durations were and on the flip side, its vulnerabilities and limitations.
All I can tell you is what I see happening and how I interpret it. As always I invite you to ask questions if I am unclear, set me straight if I am going down a wrong path or generally add to my own knowledge base as some of you so kindly do.
This is the market report that uses Wonderland imagery as part of its presentation and what is happening now on the macro is exactly the reason why. Yet I am surely not the answer man, but I am a bullshit detector, decoder and manager.
In some ways I am happy to see what I see out there because it is definite proof (to my eyes) that we are on the right track in viewing the markets as a Wonderland of possibilities… “what it is it wouldn’t be, and what it wouldn’t be, it would. You see?” –Alice
But I am also deeply disappointed in other ways as I know many other rational and thoughtful people are. That is because it is downright scary when something takes off the mask of pretense as the BoJ did last week and just looks you straight in the eye, raw and unvarnished. It’s honest, I’ll give them that. But in some ways it really was a scary Halloween trick. Thinking of some potential implications, my blood runs cold.
We are not in Kansas anymore. We are down the Rabbit Hole and the charts directly above are the maps, or better yet the levers to which policy seems to have no end in its efficacy and its power.
I think what scares me personally is the feeling, as a market participant and as a member of society, of being controlled, without a say in the matter. With inflation ongoing, inflation signals are nonexistent and free license is given to more inflationary policy, while in the light of day prudent people (i.e. savers and non-asset owners) are being punished mercilessly on a global level… and the markets cheer this.
My daughter and I watched The Texas Chainsaw Massacre, Part 2 on Halloween night. In this entertaining and cheesy version of the cult franchise Dennis Hopper, wielding a chainsaw himself, continually repeats “Tear it Down… Tear it ALLLL Down!” as he saws his way through the underground dwelling of the homicidal chili makers.
Honest people can be forgiven for having similar sentiments toward the globally connected apparatus that is the modern financial market. Meanwhile, this market report will probably go back to its normal operation next week and to paraphrase Bob Dylan, simply seek to be on the right side of whatever side there is going forward. On to some more monthly charts and a Wrap Up…
NFTRH 315 went to finish up a report that basically wrote itself, since so many things, seemingly bizarre though they may be, are being made clear and are easily assessed.
********
Subscribe to NFTRH Premium for your 25-35 page weekly report, interim updates (including Key ETF charts) and NFTRH+ chart and trade ideas or the free eLetter for an introduction to our work. Or simply keep up to date with plenty of public content at NFTRH.com and Biiwii.com.
More from Silver Phoenix 500


