Current Position Of The Market


SPX: Very Long-term trend – The very-long-term cycles are in their down phases, and if they make their lows when expected, there will be another steep decline into late 2014. However, the Fed policy of keeping interest rates low has severely curtailed the full downward pressure potential of the 40-yr and 120-yr cycles.
Intermediate trend – One final high needed to produce the start of an intermediate correction.
Analysis of the short-term trend is done on a daily basis with the help of hourly charts. It is an important adjunct to the analysis of daily and weekly charts which discusses the course of longer market trends.
ONE MORE PULL-BACK
Market Overview
The anticipated decline took place, was violent, but short-lived. After a 33-point decline (including overnight futures) on Thursday, SPX immediately recovered with a 20-point rally on Friday.
Obviously, the market is not yet quite ready for a severe and lasting correction. If it were, last week’s decline would have been extended to a minimum of one hundred points. Instead, this action is suggesting that we are making a high level consolidation before what will probably be the final push to a new high. THEN, we can have a solid correction.
But neither are we quite ready for that final push. Next week is likely to complete the corrective move which started at 1985. Think of Thursday’s low as wave A, Friday’s high as wave B and next week should be C, completing by the end of the week. That’s the way it looks at the moment and, if Monday turns out to be a down day, we will have our confirmation.
In strong bull markets, there is always one more high, and one more high … and one more high -- until there is no more! This is not to suggest that the next high will be the final high of the bull market. But it could precede the worst correction in both time and price since the 2011 April-to-October corrective move. When the coming intermediate correction (which could last until the cycle lows of October 2014) is over, we should then embark on the final wave of the bull market.
My thinking was that last week’s correction could turn into something more severe. But for that to have happened, SPX had to close below 1952 on a daily basis. The level was tested overnight between Thursday and Friday and held. It could be tested again in the coming week before we end the correction. The Russell 2000 remains one of the weakest indexes, losing more ground than any other last week, and finding support just above its 200-DMA. XBD (American Securities Broker/Dealer) fared a little better but also needs to be kept under close watch. It would not be surprising if neither one failed to make new highs on the final rally while SPX and other stronger indices do. Finally, QQQ may find it difficult to rise much higher, even if new highs are achieved in the other indices.
Chart Analysis
Had there not been a strong close on Friday the weekly chart might have suffered some technical damage. But that did not happen, and there is still no sign that it is in the process of breaking down. So we’ll analyze the daily SPX chart, as we normally do each week.
Even through the SPX remains in a long-term uptrend and continues to make new all-time highs, it is obvious that it is slowly losing its upside momentum since it made a low at 1814 – or perhaps I should say from 1862. Since that low, four minor trend lines have been broken, but on Thursday, SPX tested the (blue) trend line from 1814, and it held. There are other reasons why 1952 held: this level had been a previous low recently, and the decline found support on a purple parallel.
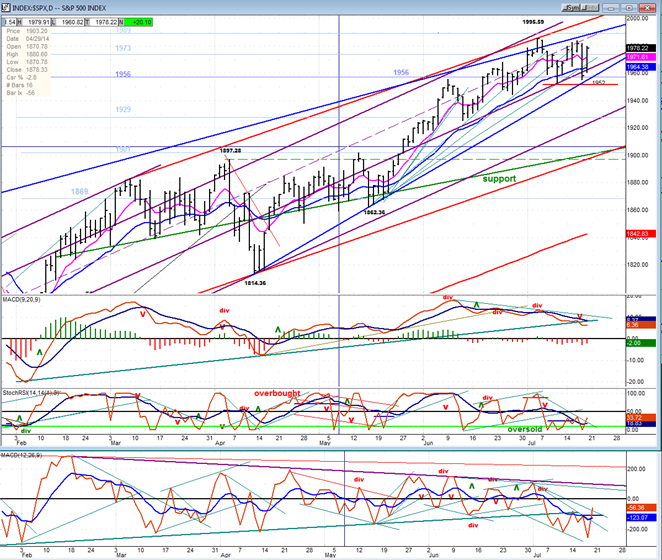
With regards to the oscillators, I had pointed out last week that the A/D MACD had broken an intermediate term trend line and if this was duplicated by the MACD, we could start a deeper correction. That oscillator started to break the trend line in question, but it quickly found support on previous highs and did not achieve enough of a penetration. If we get another pull-back, it may very well continue its decline, but until it actually goes negative, it will not forecast anything very serious. I sometimes forget that oscillators are normally one step ahead of the price. In other words, the breaking of the A/D trend line is only a warning that, after its recovery, the next down move is likely to take the market with it.
The third oscillator (SRSI) has been oversold for a couple of weeks. Friday’s rally, in spite of its strength, was not enough to turn any of these oscillators around decisively; but the next time the index has a rally they should be in a position to give a short-term buy signal.
The hourly chart shows the rapidity of the down move to the blue trend line and how quickly prices bounced back in a typical “V” bottom formation. What the action amounts to, is that we broke a short-term trend line from the previous low and rallied back up to it in a back-test where the index found resistance. The up-move probably came to an end because it hit a projection as well as a CIT (change in trend) point. With the odds favoring an extension of the consolidation, it looks like we hit the top of the bounce at the end of the day on Friday, and should continue the correction on Monday (plus two or three days). Providing that we remain above the blue trend line, and 1952, the consolidation should be over by the end of the week.
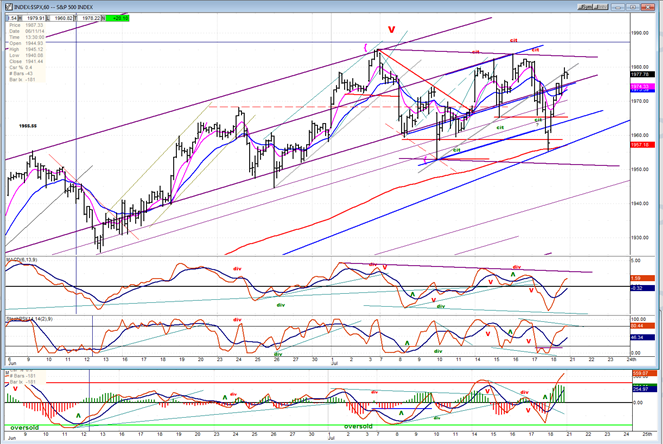
Adding to the probability of a pull-back from here, the A/D indicator is very overbought and its histogram has already started to turn down. This should be followed by all three oscillators rolling over. 
Cycles
A 9-day cycle made a high on Wednesday. An 8-wk cycle is due at the end of next week
Breadth
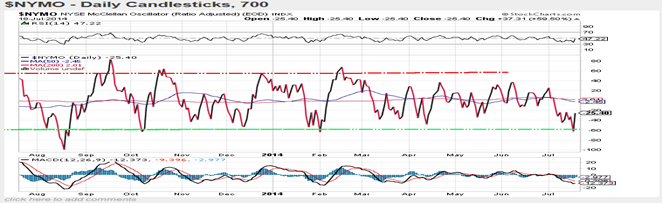
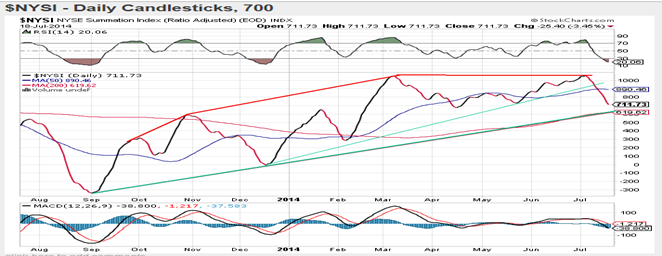
The McClellan Oscillator and the Summation Index appear below (courtesy of StockCharts.com).
The McClellan oscillator corrected down to the level where it normally becomes oversold and from which it rallies unless a significant correction is starting. You can see examples of both on the chart below.
This has sent the NYSI into a steep retracement -- just below its former short-term lows and ready to challenge the uptrend line from September. If we extend the correction another week, there is a good chance that the trend line will be breached. The RSI is just entering the oversold area which may signal a likely continuation of its decline to a lower level.
Sentiment Indicators
The SentimenTrader (courtesy of same) long term indicator remains at 60 but should climb right back to 70 if SPX makes a new high.
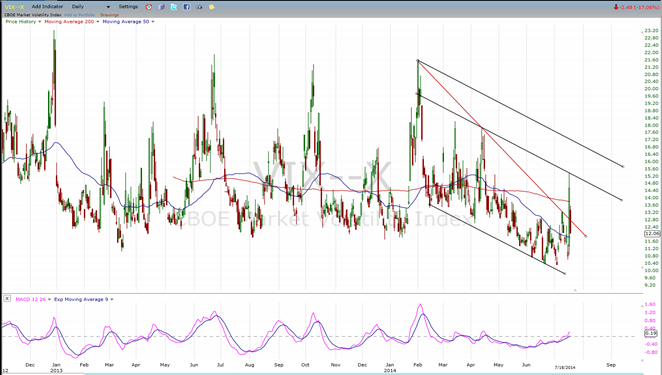
VIX (CBOE volatility Index)
First attempt by VIX to go through its short-term down-trend line was successful. The move stopped at an inner parallel and pulled-back. It should advance again next week as the market continues its consolidation. Eventually, it will have to move out of the channel entirely as the market is breaking down into a larger correction. But this is not likely to be immediate.
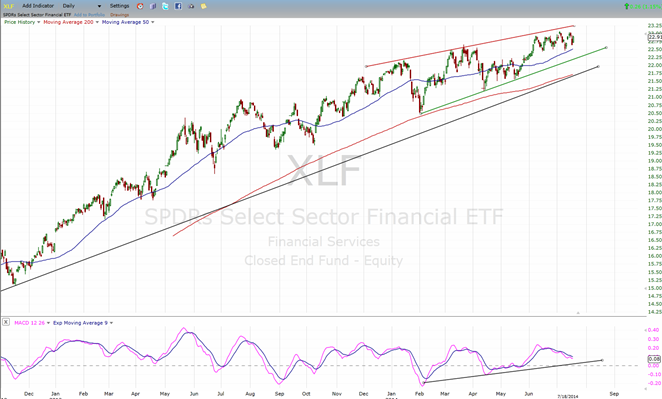
XLF (Financial ETF)
XLF continues to trade with SPX, but remains slightly behind. No real predictive action at this time.
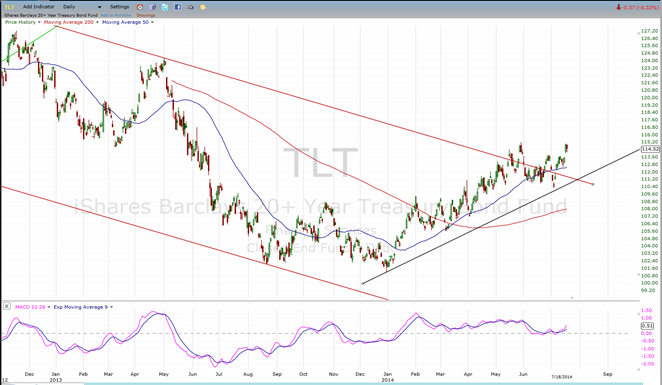
TLT (20+yr Treasury Bond Fund)
TLT is trying a little harder to move out of its channel. It’s only a matter of time before it reestablishes its uptrend.
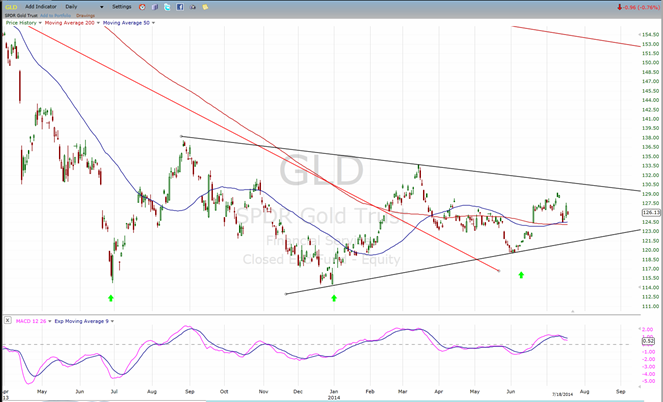
GLD (ETF for gold)
GLD is having some difficulty moving out of its base pattern. It is unlikely to do so until the market is ready for a more substantial correction but, by then, a lot of the cycle’s up-phase will have been used up.
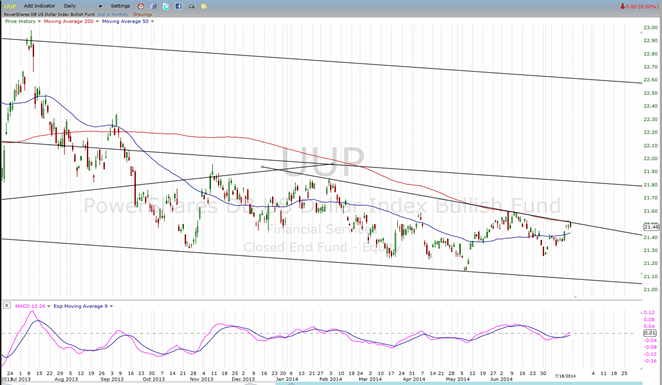
UUP (dollar ETF)
UUP is moving opposite to GLD. Just as GLD is unlikely to move down significantly at this time, neither is the dollar ready for a strong up move.
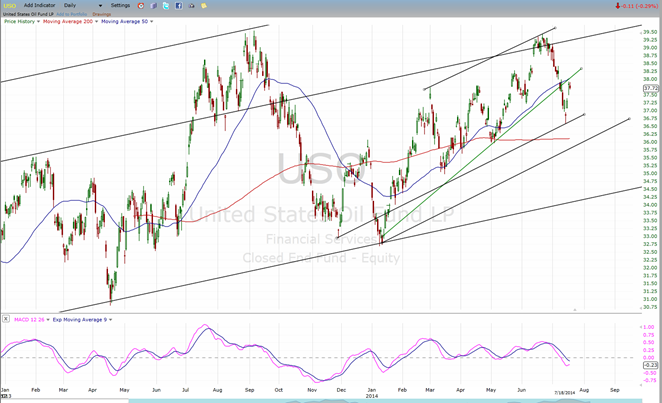
USO (US Oil Fund)
USO has backed off the double-channel top lines of resistance, and found temporary support on an inner parallel to the lower trend line of the smaller channel. It is currently back-testing the broken trend line.
Summary
An attempt by SPX to start a meaningful correction was foiled when it failed to break through the 1952 support level which coincided with a trend line from 1814. The bounce off that trend line (blue on the daily chart) has now given it a third point of contact which considerably improves the chances of a much more substantial price retreat taking place the next time it is challenged and breached.
Next week, SPX should continue its consolidation above 1952 (perhaps a little lower) and, by the end of the week, be in a position to attempt making a new high.
********
FREE TRIAL SUBSCRIPTON
Market Turning Points is an uncommonly dependable, reasonably priced service providing intra-day market updates, a daily Market Summary, and detailed weekend reports. It is ideally suited to traders, but it can also be valuable to investors since highly accurate longer-term price projections are provided using Point & Figure analysis. Best-time reversal estimates are obtained from cycle analysis. The recent addition of CIT (Change In Trend) analysis has greatly improved the exact timing of reversals.
For a FREE 4-week trial, send an email to: info@marketurningpoints.com
For further subscription options, payment plans, weekly newsletters, and for general information, I encourage you to visit my website at www.marketurningpoints.com. By clicking on “Free Newsletter” you can get a preview of the latest newsletter which is normally posted on Sunday afternoon (unless it happens to be a 3-day weekend in which case it could be posted on Monday).
The above comments and those made in the daily updates and the Market Summary about the financial markets are based purely on what I consider to be sound technical analysis principles. They represent my own opinion and are not meant to be construed as trading or investment advice, but are offered as an analytical point of view which might be of interest to those who follow stock market cycles and technical analysis.

When Andre Gratian was a stock broker years ago, a friend introduced him to technical analysis of the market. Consequently, it is not an exaggeration to say that Andre fell in love with this approach! Ever since then, it has become an increasingly important part of his professional life. Gratian has studied the works of Wyckoff, Edwards & Magee, Edward J. Dewey (cycles) and many others. However, one of my most profitable undertaking has probably been to study Point & Figure charting, which he finds invaluable in analyzing stocks and indices. If he were restricted to one methodology, this is the one that he would choose. This well-rounded background has given him what he feels to be a special insight into the stock market, facilitating the recognition of meaningful patterns and the ‘turning points’ in all trends, whether they be short or long term. Andre feels very comfortable discussing the stock market and passing on meaningful information to others. His subscribers include individuals and money managers throughout the world. Moreover, his Newsletters are currently published on several financial sites, here and abroad.
More from Silver Phoenix 500


