Do The Oil Bulls Have Any Aces Left Up Their Sleeves?


Crude oil has had an eventful session yesterday. It has closed the opening gap and the bulls have been building upon their gains till the session’s close. Earlier today however, the price appears to be rolling over and heading south. Is all hope for higher oil lost? The bulls have shown to be quite tireless. Can they pull a rabbit out of their hats shortly?
Let’s take a closer look at the chart below (chart courtesy of http://stockcharts.com).
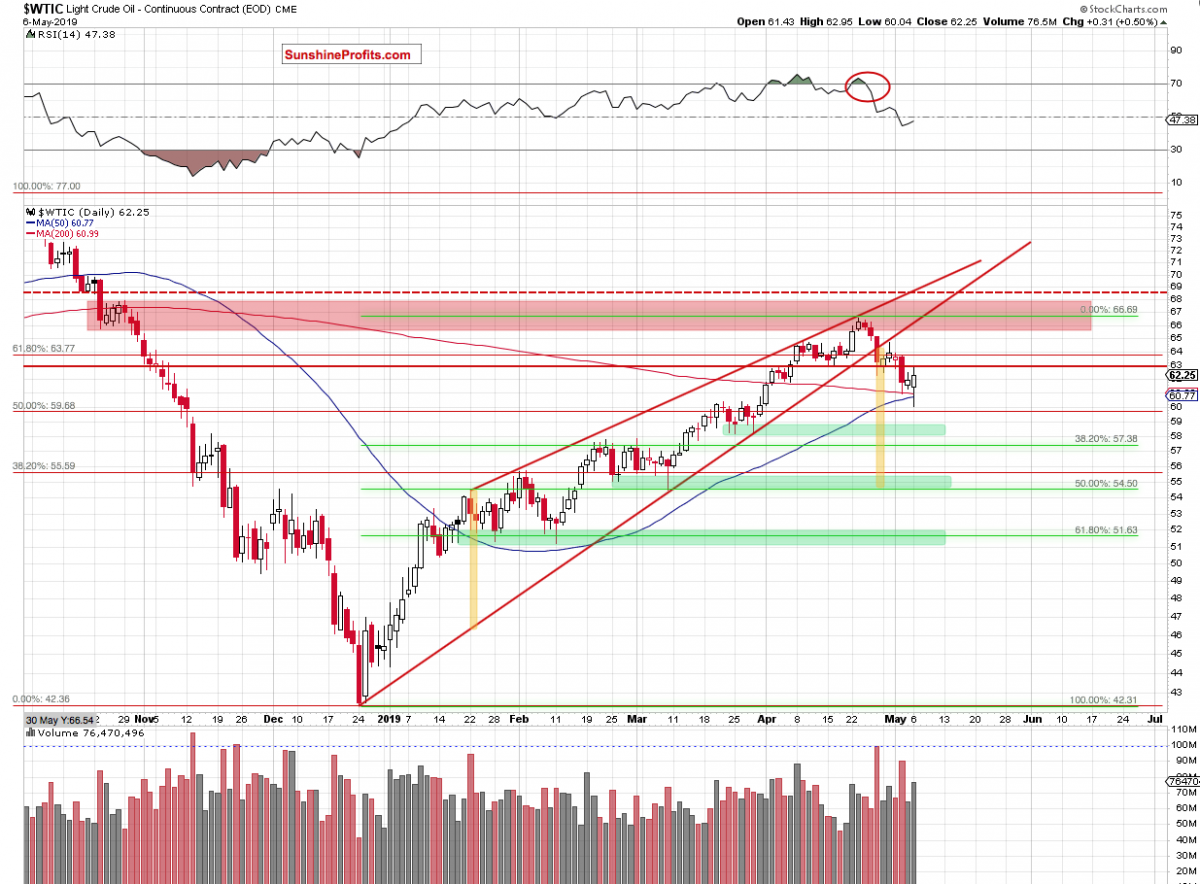
Yesterday’s session started with a sizable gapping move down that reversed later in the day. The gap has been closed as testing the 200- and 50-day moving averages encouraged the buyers to act.
They’ve taken the commodity to almost $63 but the previously-broken red horizontal resistance line (based on mid-April lows) stopped them. Such price action looks like verification of the earlier BREAKDOWN and suggests that another attempt to move lower may be just around the corner.
The daily indicators would support such a scenario. They are free from any buy signals. Therefore, if oil moves down from here, we’ll likely see another test of the 200- and 50-day moving averages. Such a test would then be likely followed by a drop to the first green support zone or even the 38.2% Fibonacci retracement.
Summing up, the outlook for oil remains bearish. Monday’s reversal of the gap brought higher prices but appears to be rolling over. This is what a verification of the breakdown below the red horizontal resistance line that’s based on mid-April lows looks like. There’re no buy signals on the daily indicators while the weekly ones remain on sell signals. The bearish divergences between the daily indicators and the oil price itself are getting their downward price resolution. The profitable short position continues to be justified.
If you enjoyed the above analysis and would like to receive daily premium follow-ups, we encourage you to sign up for our Oil Trading Alerts also benefit from the trading action we describe. We encourage you to sign up for our daily newsletter, too – it’s free and if you don’t like it, you can unsubscribe with just 2 clicks. If you sign up today, you’ll also get 7 days of free access to our premium daily Gold & Silver Trading Alerts. Sign up for the free newsletter today!
Nadia Simmons
Forex & Oil Trading Strategist
Sunshine Profits - Tools for Effective Gold & Silver Investments
* * * * *
All essays, research and information found above represent analyses and opinions of Przemyslaw Radomski, CFA and Sunshine Profits' associates only. As such, it may prove wrong and be a subject to change without notice. Opinions and analyses were based on data available to authors of respective essays at the time of writing. Although the information provided above is based on careful research and sources that are believed to be accurate, Przemyslaw Radomski, CFA and his associates do not guarantee the accuracy or thoroughness of the data or information reported. The opinions published above are neither an offer nor a recommendation to purchase or sell any securities. Mr. Radomski is not a Registered Securities Advisor. By reading Przemyslaw Radomski's, CFA reports you fully agree that he will not be held responsible or liable for any decisions you make regarding any information provided in these reports. Investing, trading and speculation in any financial markets may involve high risk of loss. Przemyslaw Radomski, CFA, Sunshine Profits' employees and affiliates as well as members of their families may have a short or long position in any securities, including those mentioned in any of the reports or essays, and may make additional purchases and/or sales of those securities without notice.
More from Silver Phoenix 500


