Dow The Contrarian Play


I’ve been calling for one final high in the Dow to put an end to this most awesome bull market. This can be quite the mental challenge in the face of declining prices with many market commentators already calling the top in. But I remain steadfast. I still believe the final high is yet to be seen.
To make matters more interesting, the major support of the August 2014 low of 16333 has now been cracked. This level has been a line in the sand and the focus of many analysts. That includes me. However, it is now so obvious that my warning bells are ringing.
The popular view seems to be that breaking this level means the bull market is dead and lower prices are a fait accompli. That may well be so.
The contrarian view would surely now be that the bull market is not over and it is this view that currently holds sway over me.
Let’s take a look using the charts.
DOW DAILY CHART
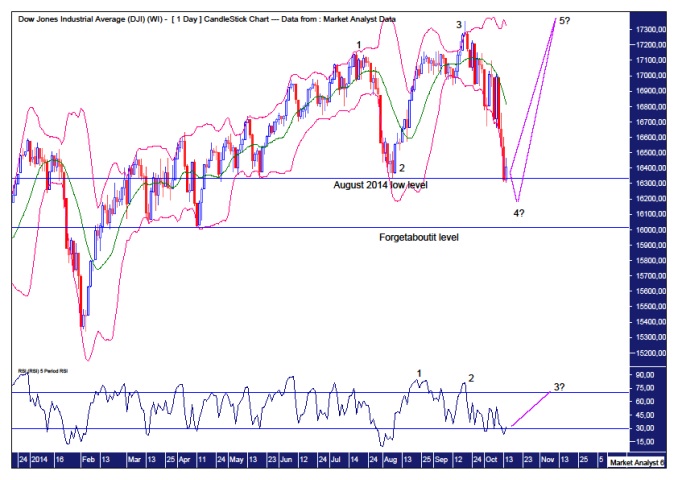
The Bollinger Bands show price clinging to the lower Bollinger Band as per a normal downtrend. Despite the rally today there is still no real sign of price breaking away from this lower band.
The higher horizontal line refers to the August 2014 low level which was only marginally breached. Price has rallied a little from here and this sets up a possible double bottom which could be expected to lead to a new high.
Another possibility is that price breaks to new lows before reversing higher. Price breaking down now to further below the August 2014 low would certainly look bearish and buying into that move would not be for the faint hearted. The contrarian play often appears to be the most dangerous play.
Price then putting in a new low and reversing back up would set up the potential for a big broadening top with the August low point 2 and the current low point 4. Then a move to new highs would set up point 5 to finish it off.
The lower horizontal line refers to the April 2014 low level of 16015 which I have labelled the Forget-about-it level as that really is the line in the sand for me. I can’t see new highs being made if that level is taken out.
I have added a Relative Strength Indicator (RSI) which shows a bearish divergence from the last couple of consecutive highs. I would like to see one final high accompanied by yet another lower high in the RSI – a triple bearish divergence. Time will tell.
So, the way I currently see it, there are two possibilities that I favour. The first is price rallies from here with a double bottom propelling it to new highs. The second is price washes out further into a new low before rallying into a new high to set up a big broadening top.
Both of these possibilities call for one last marginal high to end the bull market.
What are some other possibilities?
Price rallies but fails to make a new high instead turning back down putting in a secondary top or price crashes from here.
Without doubt things are starting to get volatile and the VIX is testament to that. Let’s quickly take a look.
VIX DAILY CHART
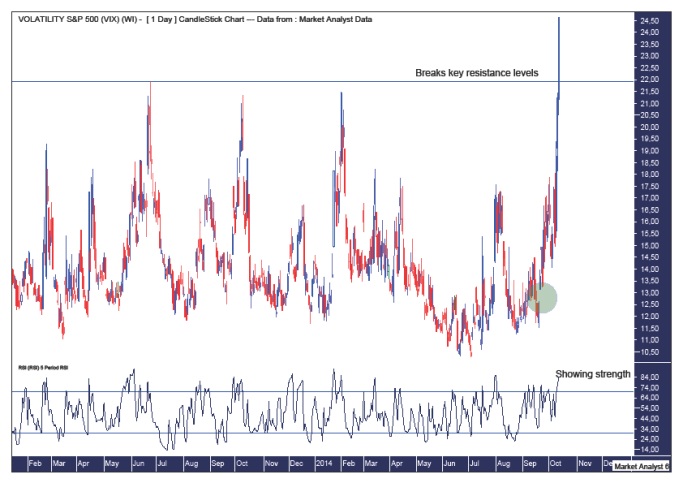
There has been a strong move higher in the VIX which has busted some key resistance levels. There can be no doubt now about the trend of the VIX – up.
The RSI shows the strength currently being exhibited by price in busting its own resistance level from recent tops.
However, there is something niggling about this chart. That is the existence of a gap as shown in the green highlighted circle. Now I’m not one to make gaps the holy grail of trading. I just have a bee in my bonnet about this one. I really would like to see this gap filled before the VIX really starts to rock n roll. Some may say the VIX is already rocking n rolling with the recent move higher. To me this is the acoustic guitar move with the Fender Stratocaster move still to come.
Summing up, I am very bearish about the outlook for the Dow over the next couple of years. I would just like to see one final high and the gap in the VIX to be filled to make the picture look perfect to me.
********
© 2014 Copyright The Voodoo Analyst - All Rights Reserved
Disclaimer: The above is a matter of opinion provided for general information purposes only and is not intended as investment advice. Information and analysis above are derived from sources and utilising methods believed to be reliable, but we cannot accept responsibility for any losses you may incur as a result of this analysis. Individuals should consult with their personal financial advisors. Put simply, it is JUST MY OPINION.
More from Silver Phoenix 500


