Droke on Gold & Silver


A silver sling-shot set-up
September 16, 2002
Critical underlying support: $4.52
Critical overhead resistance: $4.65
December Silver futures have the chance to literally "sling-shot" to higher highs in the next couple of weeks based on an interesting pattern that has formed in the daily chart. Note the configuration of market curves in the chart below.
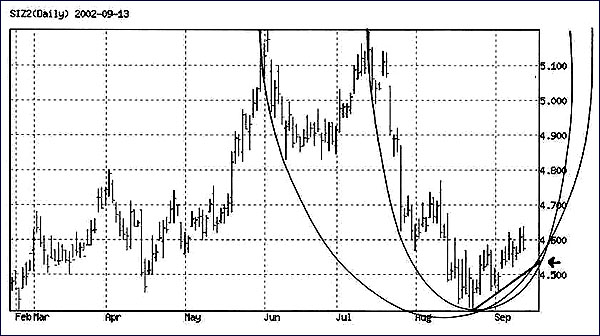
From this graph we can grasp not only silver's critical near-term parameters and potential breakout levels, but we also get a good view of what the current supply/demand balance looks like. In the above chart of silver's daily prices there are three conspicuous features worth noting. The first is a steep parabolic bowl that can be drawn from the July highs down to the August lows and back up through September. We note with interest that silver bottomed at the precise mid-point, or "vertex," of this parabola in August (at about $4.40) and have kept within the confines of the bowl since then. As long as the rim of this bowl isn't violated (currently at around $4.52) the set-up for an upside resolution of its recent consolidation remains intact.
Secondly, and perhaps more importantly, note the much larger parabolic bowl that started forming with the early June highs at the left rim, with the vertex in August. The larger 4-month bowl coincides very closely with the smaller 2-month bowl with the rims of both bowls currently intersecting near the $4.52 area. Also note a 3-week rising trendline that also intersects around $4.52. This is a triple-strengthening of the $4.52-$4.53 area as a major price pivot and potential supporting floor. A penetration below $4.52 would be bearish, as both bowls would then be broken, but holding above $4.52 in coming days and then reversing higher would be a good sign of higher prices to come.
Thirdly, there the descending line of supply (not shown) that stretches from the July highs down through September and currently intersects $4.60-$4.62. This must be considered as the confirmation level of an attempted upside breakout from the triangle.
While this line of supply is providing a lot of overhead pressure right now, there is a good chance it will be overcome this month considering the bullish implication of the bowl and trendline patterns and the bullish seasonal implication of the September-October timeframe.
Again, breaking below $4.52 and then $4.47 would eliminate the bullish potential of this chart pattern set-up and would pave the way for a test of this year's lows and possibly to lower lows. But breaking above $4.60-$4.62 would almost certainly lead to a fast and furious ascent to higher levels, most likely to at least $4.80-$4.90 before further resistance is encountered.
* * * * * * * *
Dueling forces, part 3
September 16, 2002
Critical underlying support: $315
Critical overhead resistance: $325-$326
In our previous two gold futures commentaries we noted that the daily gold futures chart is a classic example of "dueling forces," or the conflict between the bulls and bears. We highlighted this beautiful parabolic bowl pattern plainly visible in the daily chart and asserted that "It's the kind of pattern that will literally make or break a market as it represents two powerful forces vying for control of the market with only one winner." Let's examine the updated daily gold futures chart (below), a remarkable study in market forces.
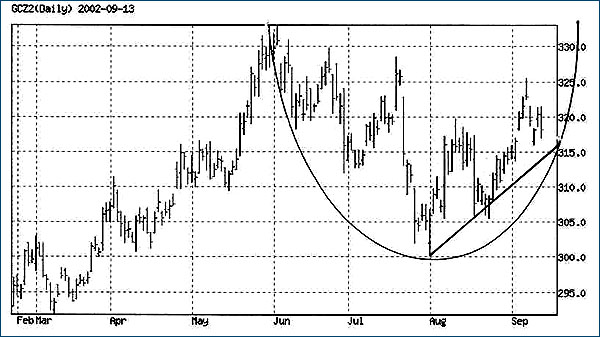
Note that the parabolic bowl that has formed since the early June peak is still intact. When we published part 1 of the "Dueling Forces" series, gold prices had just passed the mid-point, or "vertex," of the bowl after having bottomed smack-dab in the middle of the bowl at $300 on August 1. This was a strongly bullish indication that prices would seek higher levels, at least in the short term. Since that time prices have moved higher despite great volatility and frantic whipsaws along the way.
In our last gold futures report ("Dueling Forces, part 2") in early September, we noted that "gold broke above the mid-point of a three-pronged upward trading channel [in the daily chart]." We further forecast that "Prices appear to be headed toward the next highest benchmark of $324-$326, an area of strong potential resistance." We noted further that not only is there a nearly 3 ½ month declining trend line that intersects that area but that $325-$326 also represents the top of the three-pronged trading channel. Moreover, we noted that $324 approximates to the 75% retracement level of the June-August decline. The 75% retracement was a favorite of W.D. Gann since he found it to be an extremely common one in most actively traded commodities.
Since the first week of September when we published that report, gold futures prices indeed made it to about $326 (intra-day) on Monday, Sept. 9. This fulfilled the 75% Gann retracement, and prices promptly reversed before finding support at around $316. December Gold closed down $2.20 on Friday at $316.50 and appears to be headed for another test of that important $315-$316 pivotal area. If you'll look at the gold futures chart above, you'll note that the area between $315-$316 is precisely where a 6-week uptrend line intersects the rim of the parabolic bowl in the daily chart. This strengthens $315-$316 as an important benchmark, and its ability or inability to support the market this week will ultimately determine gold's next short-term swing. Bottoming at or above $315 and reversing would allow gold to get the benefit of the "juiced" rim of the parabolic bowl, which should allow for another test of that $325 overhead resistance area this month. But breaking below $315 would effectively break the trendline and the bowl and would likely be followed by another "correction." It would also mean gold would have to spend more time absorbing the additional overhead supply and would have to spend time working out the weakness before its next attempted rally.
On the upside, remember also that we pointed out in the last "Dueling Forces" report that in breaking out of a 4-week symmetrical triangle pattern in August it had technical upside measuring implications to $330-$335. The fast rally to $326 followed by the throwback to $316 could actually be considered as "normal" technical behavior for prices coming out of a triangle pattern. Throwbacks down to, or slightly above, the breakout point are not uncommon in this type of pattern. Therefore, gold still has a chance of making it to as high as $335, if not higher, if it bottoms successfully above $315-$316 and then rallies back above $326.
To repeat our summary of the gold market from the previous report, "Volatility and whipsaws notwithstanding, the immediate trend in gold futures remains up until the rim of the parabolic bowl in the daily chart is broken. Crossing above $325-$326 would be very bullish and would probably lead to a test of the June highs. Piercing above the June highs, even if only marginally, would indicate that gold will seek higher levels in coming months (even if the new high is followed by a pullback and lengthy consolidation)."
More from Silver Phoenix 500


