Emerging Markets And Basic Materials Breaking Out Together


While most members are focused on the precious metals, I’ve been waiting patiently for two other sectors to setup a long term buy signal which I believe happened last week. I know you are well aware of my mantra that big consolidation patterns lead to big impulse moves. What’s pretty amazing is these 2 sectors have an almost identical long-term consolidation pattern and are breaking out at the same time. It stands to reason that if the Emerging Markets are going to be strong then the Basic Materials sector should benefit as well.
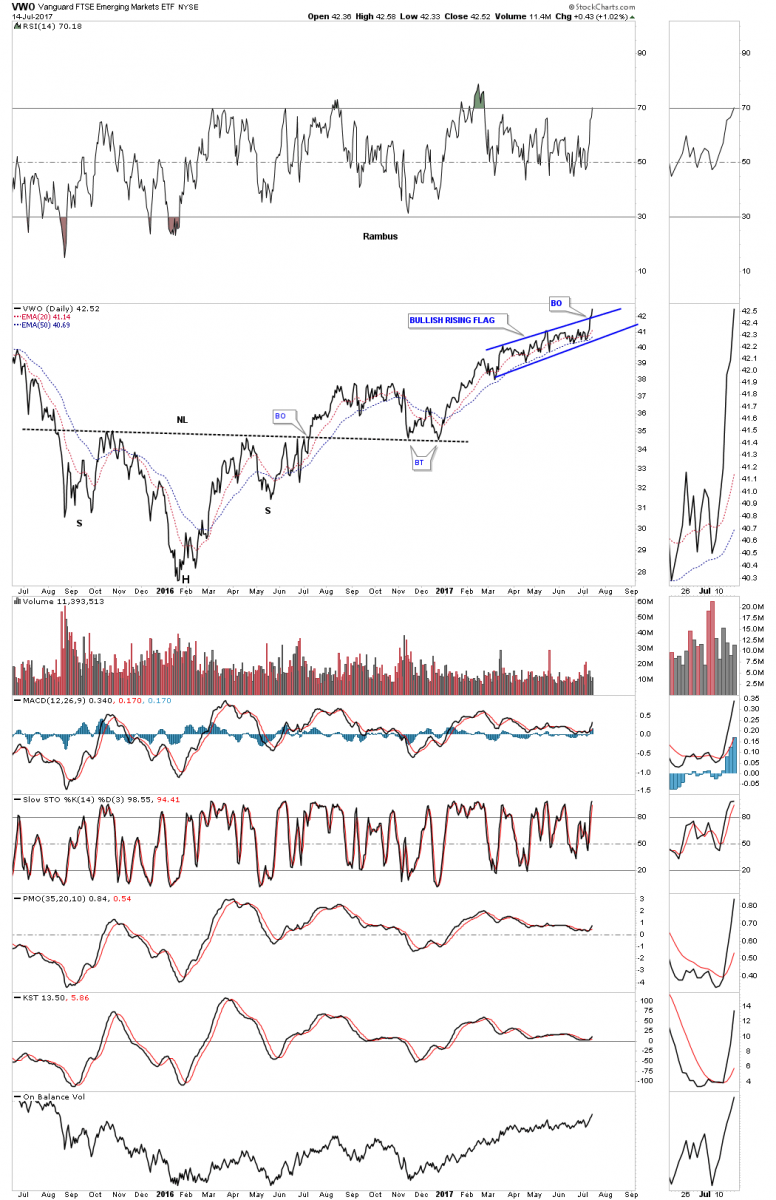
Most like to look at the EEM, emerging market index, but there is another emerging market index which trades with much more volume, VWO which I will use in this post. Let’s start with just a simple daily line chart for VWO which shows a H&S bottom in place and a breakout yesterday of the blue bullish rising flag. Keep those two patterns in the back of your mind when we look at the longer term charts.
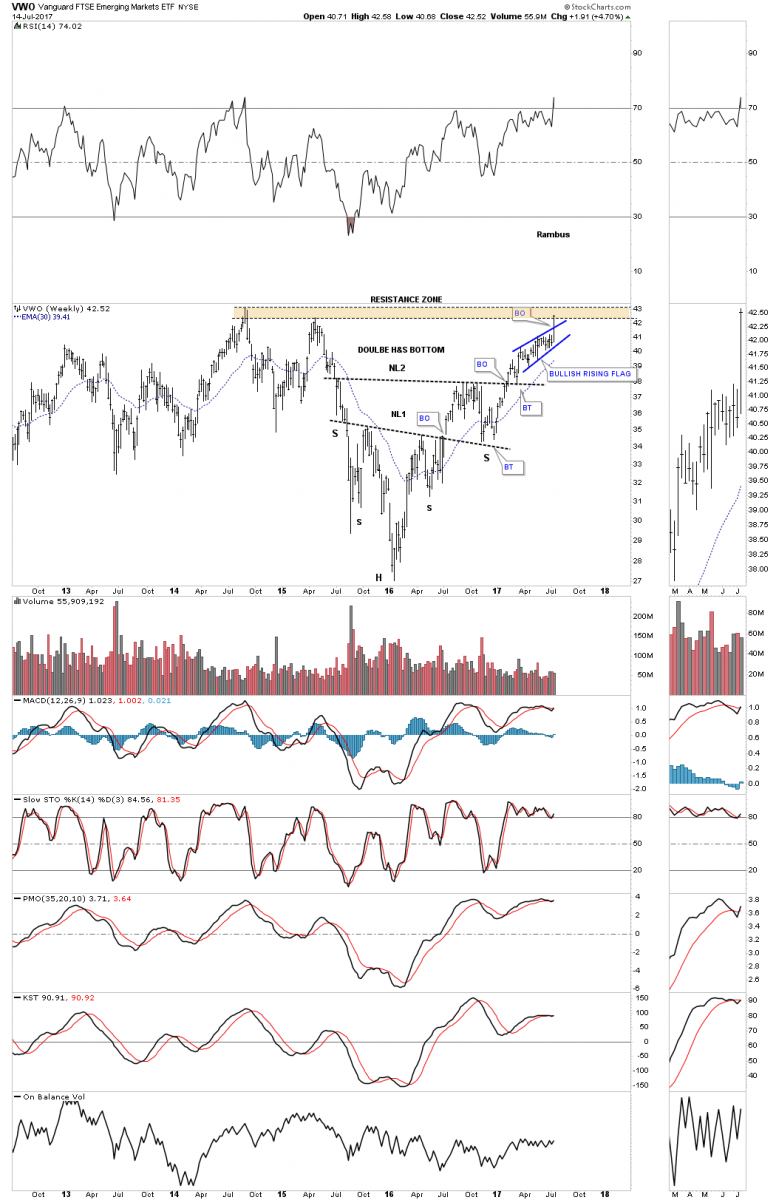
Below is a 5 year weekly bar chart which shows a double H&S bottom with the breakout of the blue bullish rising flag yesterday, which has formed just below the important overhead resistance zone. There are 2 things the blue bullish rising flag is suggesting, First these types of patterns form in strong moves and secondly it is forming just below important overhead resistance. We’ve studied this setup many times in the past which states, when you have a small consolidation pattern form just below important overhead resistance, it usually leads to a breakout. The small consolidation pattern builds up the energy needed for the final breakout move.
Now I would like to show you the long term weekly chart for the VWO so you can see the 6 year rectangle consolidation pattern that has been building out. Note how the blue bullish rising flag has formed just below that 6 year top rail of the rectangle consolidation pattern. If there was ever a place to see one of these types of bullish patterns buildout this is it.
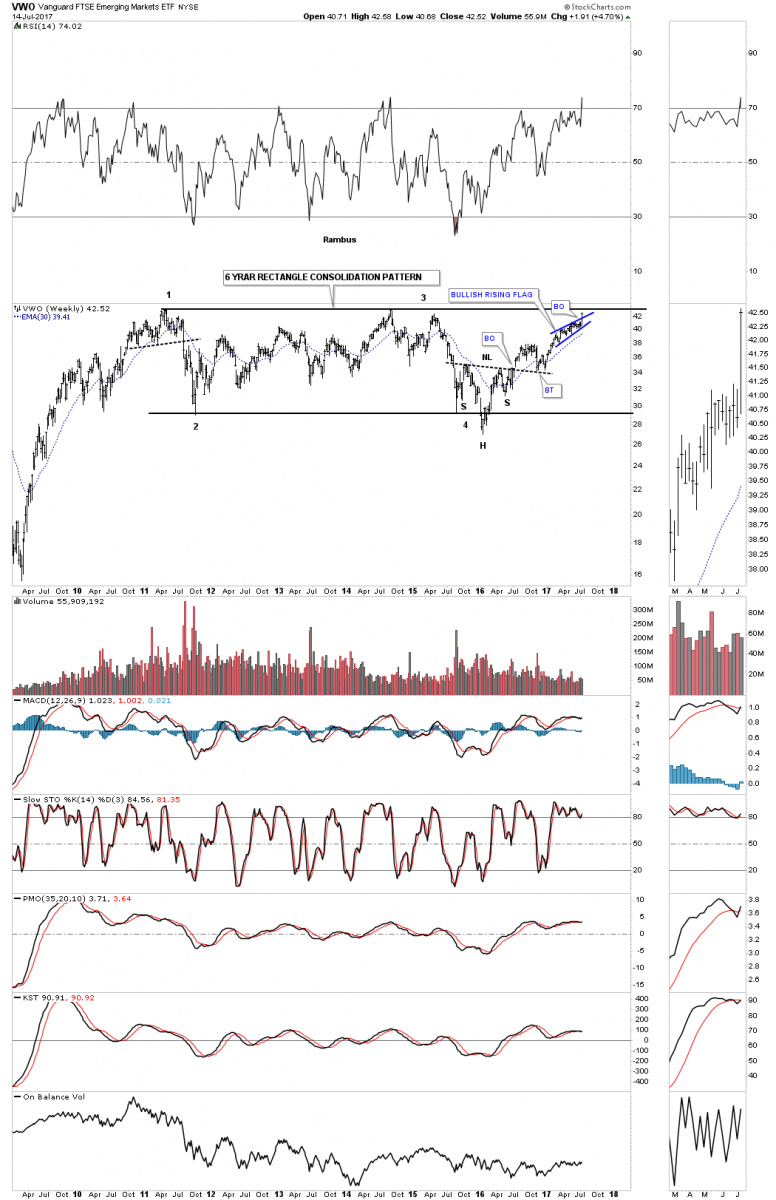
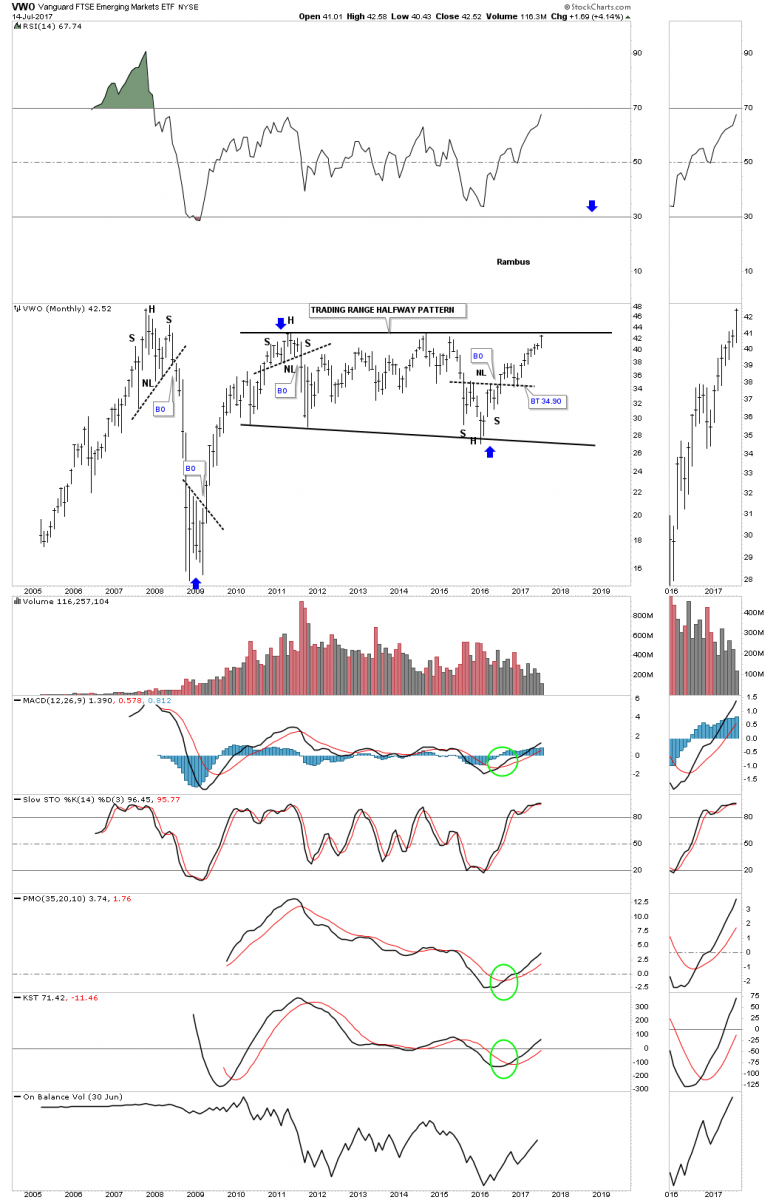
As you can see on the weekly chart above the breakout hasn’t actually happened yet. Most chartists don’t like to use line charts, but they can be a very useful tool for the toolbox. Another lesson I’ve shown you in the past is how a line chart can often times signal a breakout before a bar chart. Keep in mind a line chart just uses the closing price whether it be a daily, weekly or monthly chart. Below is a monthly line chart which shows the breakout taking place. A backtest would come in around the 40.70 area on a monthly closing basis. The bottom line is that we want to see the price action close the month of July above the top rail.
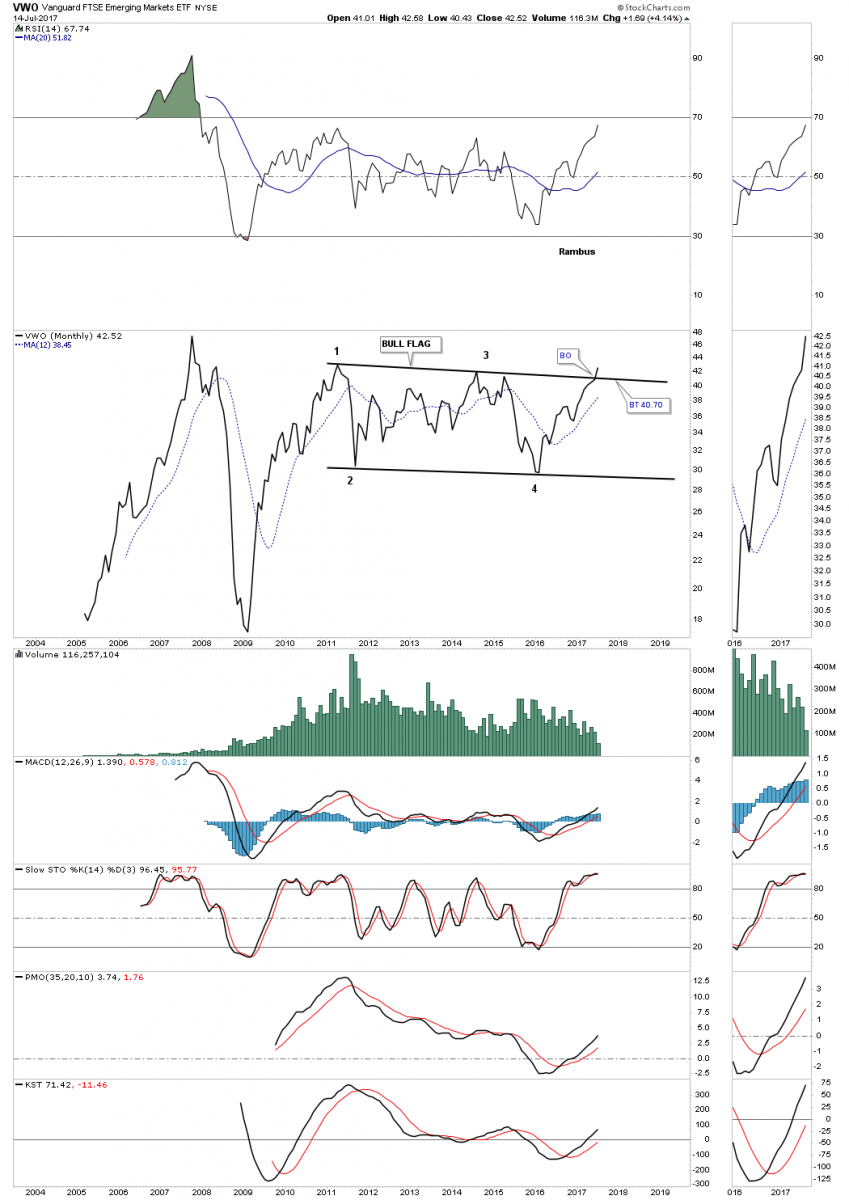
This last chart for VWO is a 20 year look which shows its entire history. With this week’s move, the all- important 4th reversal point was achieved when the top rail was hit which completes the trading range. It now becomes very important to see a strong breakout move higher leaving no doubt that the breakout is for real. A failure at the top rail would then start another reversal point to the downside which is not what we want to see.
If the breakout move continues then I would view the nearly 6 year trading range as a halfway pattern as shown by the blue arrows. I would expect we would see a similar impulse move up that began at the 2009 crash low up to the 2011 high in time and price. Big consolidation patterns lead to big moves.
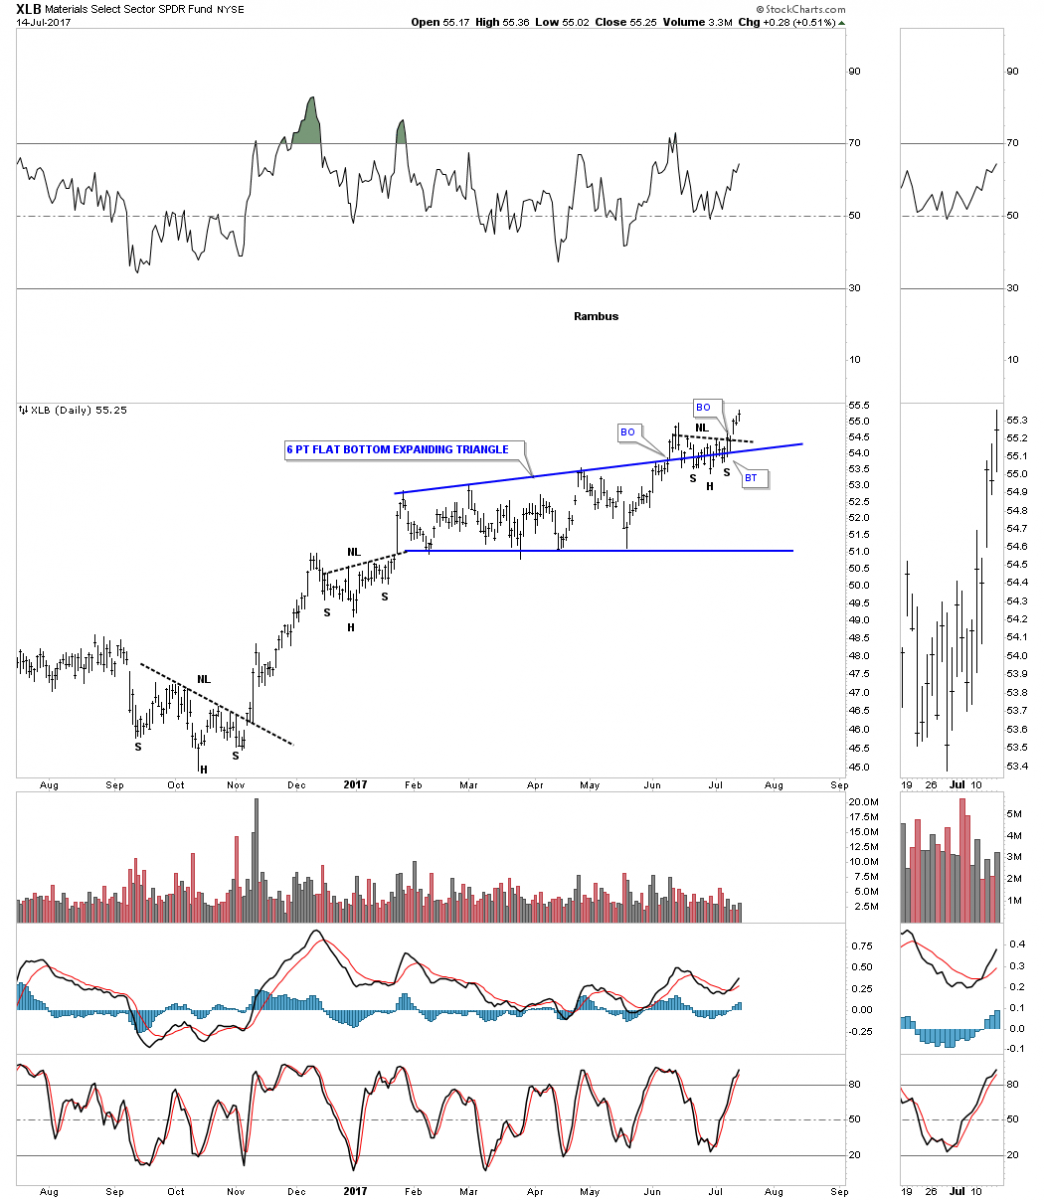
Now let’s take a look a daily chart for the XLB, basic materials index, which is showing it has just broken out 6 of a month blue expanding flat bottom triangle with a small H&S that formed as the backtest. Yesterday this basic materials index closed at a new all-time high.
What are Basic Materials and what components are in the XLB ?
http://www.etfinvestmentoutlook.com/etf_holdings.php?s=XLB
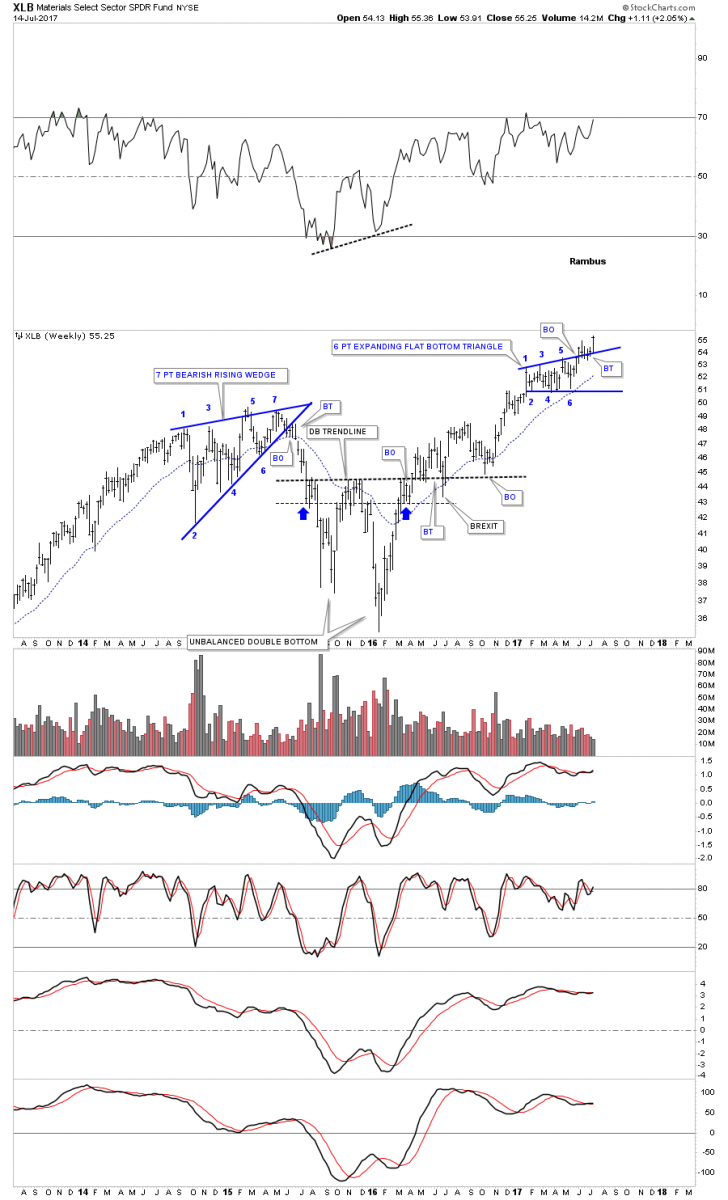
Below is a 4 year weekly bar chart that is showing the breakout from the 6 point flat bottom triangle consolidation pattern into new all-time highs this past week.
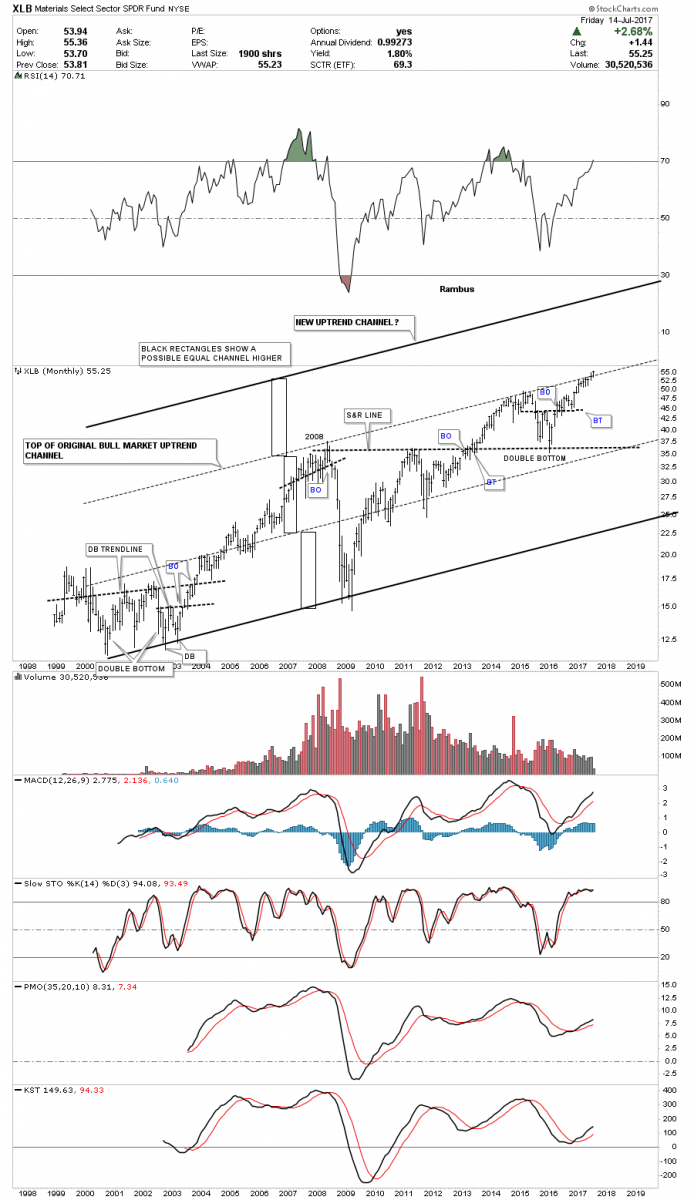
The long-term monthly chart for the XLB shows its entire history and its bull market uptrend channel. If the 6 point expanding flat bottom triangle is breaking out topside then the original top rail of the major uptrend channel will be taken out. Generally when that happens you can see another equal channel higher giving the uptrend 3 equal channels instead of two. The black rectangles shows how this new uptrend may play out.
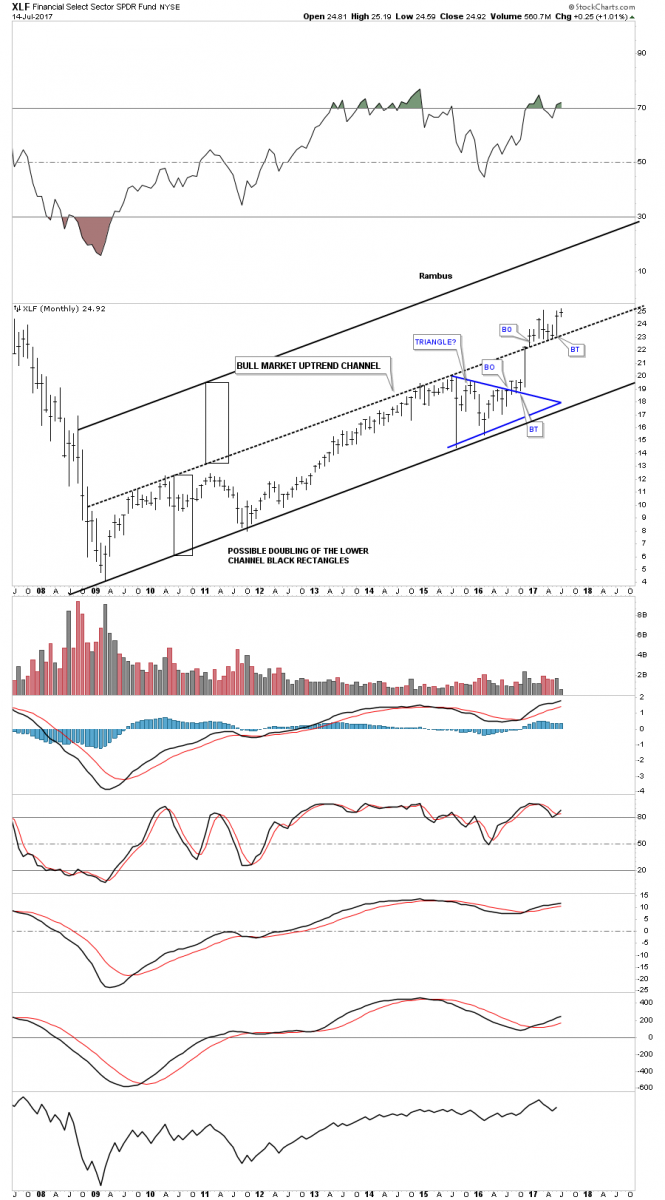
This next chart is a long term monthly chart for the XLF which I’ve been showing you how the lower channel may be morphing into a double uptrend channel with equal lower and upper channels. This is the same principle as the XLB chart above which is forming a possible third channel.
********
 Rambus Chartology is Primarily a Goldbug TA Site following the precious metals markets. Chartology is the Unique Blend of Technical Chart Pattern Identification and Market Psychology, Developed by Rambus During the Tech Mania of the late 1990s. His Early Training came the old fashioned way...Reading Edwards and McGee's Bible of Technical Analysis and spending years with a sharp pencil graph paper and ruler refining his skills and accuracy. Visit the Rambus Chartology website at http://rambus1.com/.
More from Silver Phoenix 500


