Financials Setting Up An Island Top Formation


As we continue to scan the charts for setups and trigger to alert our followers, we've come across a setup that may be more ominous than what it appears. Recently we've posted articles about how the SPY and the NQ have pushed into new all-time high price territory and how Gold is setting up for a momentum base that should launch precious metals to near highs. We've also discussed how we believe the current upside price bias in the US stock markets should last another 10~35+ days before new price weakness sets up – possibly pushing prices lower in late May or early June 2019.
Our research team has been scanning the charts looking for anything that could give us an edge to the potential setup for this price weakness in the future. We believe the Transportation Index and the Financials could be keys to understanding how far the upside rally can continue and when a price peak may begin to warn of a potential price top or rollover.
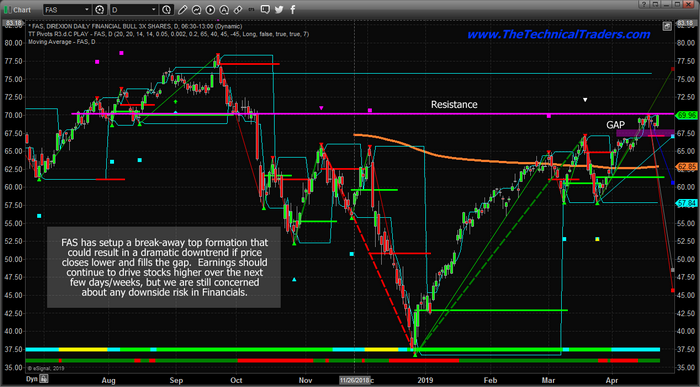
An Island Top is a pattern that sets up with an upside price gap followed by sideways price action above that gap. In theory, this type of setup should promote the gap to be filled with downside price action before any further upside price move can continue. Although, gaps to the upside are fairly common in strong uptrends. Given the strength of the earnings data released early this week and the expectations that we have for some continued upside price bias over the next 10~35+ days, we are watching these Island Top formation in the Financials for any signs of weakness to alert our followers.
This Daily FAS chart highlights the GAP as well as the Resistance levels that are currently acting as a ceiling. A breakout above the resistance level would indicate that we have more room to run higher. Any failed breakout to the upside, where price briefly rallies above the resistance level, then falls back below it, would be a pretty strong indication of a rotational peak. The Financials could fall 10% from current levels and still be within the range of the March/April lows. It would take a much bigger move to qualify as a breakdown bearish trend.

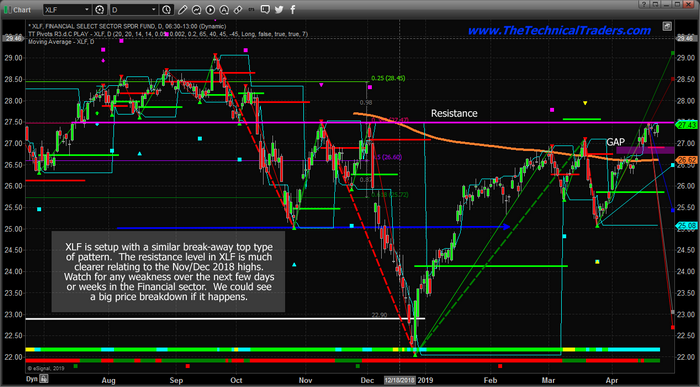
This Daily XLF chart highlights a similar pattern to the FAS chart. The key element of the XLF chart is that the Resistance level provides more key fundamental price peaks than the FAS chart. On this XLF chart, we can see that the current Resistance level aligns perfectly with the Nov/Dec 2018 highs. We can also see a short GREEN Fibonacci trigger level line in early March 2019 above the Resistance level. That Fibonacci trigger level is still valid and any move above that level would constitute a new bullish price trend trigger.
Any failure to break the Resistance level would qualify as a price rotation to fill the GAP and potentially set up a move back to near $25 looking to find new support. Overall, the Financials are poised for a move – up or down. Our research suggests the US stock market is not done rising, thus we are concerned that certain sectors may begin to show signs of weakness as the broader market continues to rise.

Our research team believes a critical peak formation is likely near the end of May or in early June 2019. It is because of this belief that we are warning traders to play the next 15~25+ days very cautiously. Watch the Financials, the Transportation Index, the US Dollar, and Precious Metals. We believe any early signs of weakness will be found within these symbols.
With a total of 55 years of technical analysis and trading between Brad Matheny, and myself Chris Vermeulen, our research and trading signals makes analyzing the complex and ever-changing financial markets a natural process. We have a simple and highly effective way to provide our customers with the most convenient, accurate, and timely market forecasts available today. Our stock and ETF trading alerts are readily available through our exclusive membership service via email and SMS text. Our newsletter, Technical Trading Mastery book, and Trading Courses are designed for both traders and investors. Also, some of our strategies have been fully automated for the ultimate trading experience.
*********

Chris Vermeulen has been involved in the markets since 1997 and is the founder of Technical Traders Ltd. He is an internationally recognized technical analyst, trader, and is the author of the book: 7 Steps to Win With Logic
Through years of research, trading and helping individual traders around the world. He learned that many traders have great trading ideas, but they lack one thing, they struggle to execute trades in a systematic way for consistent results. Chris helps educate traders with a three-hour video course that can change your trading results for the better.
His mission is to help his clients boost their trading performance while reducing market exposure and portfolio volatility.
He is a regular speaker on HoweStreet.com, and the FinancialSurvivorNetwork radio shows. Chris was also featured on the cover of AmalgaTrader Magazine, and contributes articles to several financial hubs like MoneyShow.com.
More from Silver Phoenix 500


