Footsie Triple Top


We are all aware, or those that follow the UK market are, that there is a massive triple top formation in play on the Footsie. That’s all well and good but let’s try and really nail it down by looking at both the daily and month charts.
FOOTSIE DAILY CHART
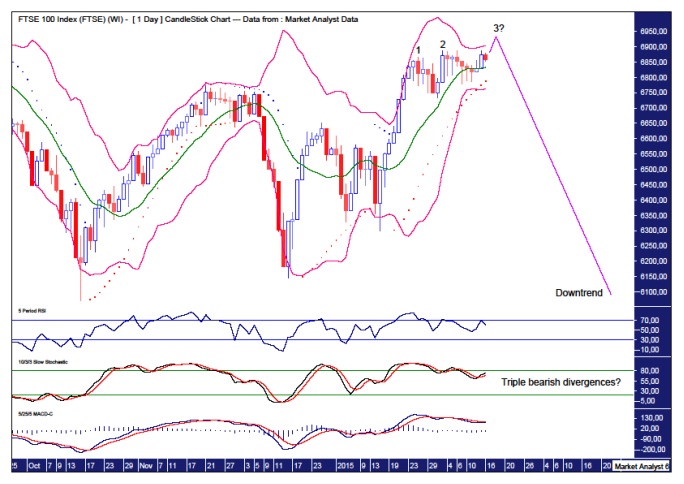
A common topping formation involves three consecutive higher highs which I like to call a “three strikes and you’re out” top. This looks to be in play here denoted by the numbers 1, 2 and 3. The first two tops appear to be in place while we still await the third and likely final high.
The coming third high looks set to be accompanied by triple bearish divergences in the Relative Strength Indicator (RSI), the Stochastic and Moving Average Convergence Divergence (MACD) indicator. This often leads to a significant decline and that is certainly my expectation here.
The Parabolic Stop and Reverse (PSAR) indicator, which pertains to the dots, still has a bullish bias with the dots underneath price so that offers no resistance to new highs.
The Bollinger Bands can be seen to be tightening up which generally means a consolidation or trend change. I favour the latter!
Also, a common feature found at tops is price trades well above the upper Bollinger band before reversing back down. I suspect that is about to play out here. The upper band is currently around 6900 so I’d be looking for the final high to be somewhere above there.
Once this coming high is in place I expect a big downtrend to commence.
Let’s now look at the monthly chart.
FOOTSIE MONTHLY CHART
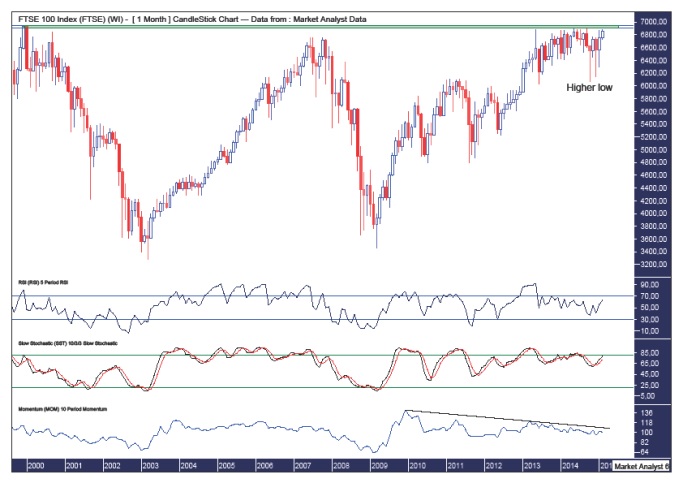
We can see the last major low, which was in October 2014, was a higher low. So a higher high was to be expected and price has recently just clipped the previous major swing high so we now have a higher high.
Assuming a massive breakout to the upside is not about to take place, the coming top is set to be accompanied by multiple bearish divergences on the RSI and Stochastic indicator while the Momentum indicator shows momentum has been declining since the first high in 2009. These are bearish indications indeed.
You could liken the current price action with a marathon runner who is finally reaching the finishing line on seriously wobbly legs after a build up of lactic acid. Well, by my estimations, price is now in the lactic acid phase!
So where is price likely to put in a top?
I have drawn a green highlighted rectangle and I expect price to top somewhere inside there. The top of the rectangle stems from the all time high set in 1999 at 6950. This level should provide heavy resistance and I doubt price will trade above there.
The bottom of the rectangle is the second higher high at 6886 and price has already pushed marginally above there so we are now right in the zone.
So the high should be between 6886 and 6950. Can we narrow it down further? Perhaps.
The 2000 high was at 6930 and I personally would like to see this coming high clip that level or at least go close. But that’s just me being finicky.
So, my target for high on the Footise is 6930 give or take a few points.
Once the top is confirmed we can look into likely levels for the bear trend to end. All in good time.
********
My website is www.thevoodooanalyst.com
© 2014 Copyright The Voodoo Analyst - All Rights Reserved
Disclaimer: The above is a matter of opinion provided for general information purposes only and is not intended as investment advice. Information and analysis above are derived from sources and utilising methods believed to be reliable, but we cannot accept responsibility for any losses you may incur as a result of this analysis. Individuals should consult with their personal financial advisors. Put simply, it is JUST MY OPINION.
More from Silver Phoenix 500


