Gappy New Year


It looked like a few rats tried to jump ship as the bell rang on 2014. But it is hard to trust any one day or week as a guide during the holidays…so we can just call it what it was, a down week within a general US market uptrend.
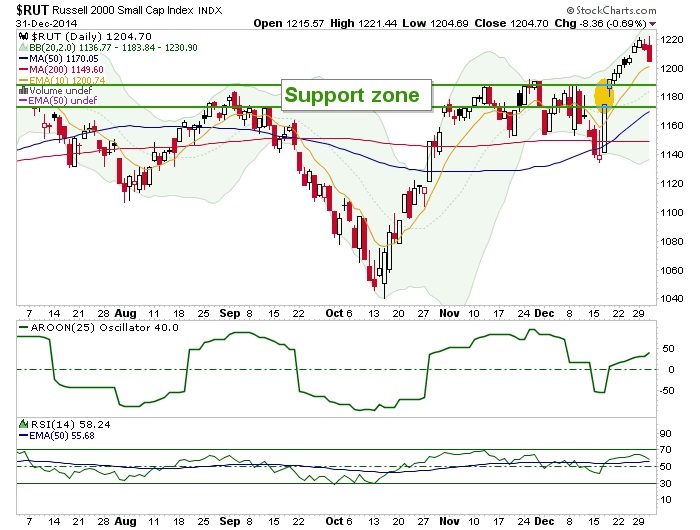
The strong uptrend however, is on the longer-term charts. Some dailies are in down trends kicked off by the pre-Santa correction (ref. the NDX below and the NYSE, as two examples). As we noted in NFTRH, the Russell 2000 was the first to go daily trend up into what is often ‘small cap season’. It has got a big fat gap though, and a test of the MA-50 seems in store.
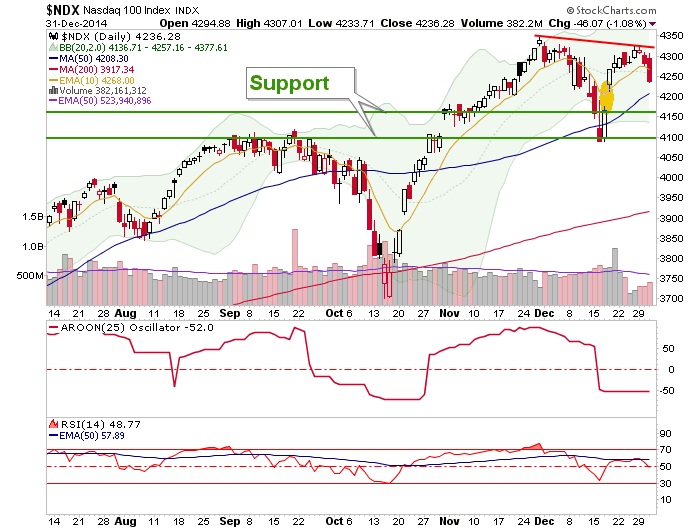
Nasdaq 100 is relatively sloppy, remains in a daily downtrend and also has a big gap to fill. Of course, this index had a lot of momo in it into December and can fall quite a way without losing its bull market. The next two support levels are shown. As an aside, I sold Tech Generals INTC, MSFT and AAPL into the post-FOMC rise with a level of remorse. Now? Not so much. They remain on watch pending coming interpretation of this pullback.
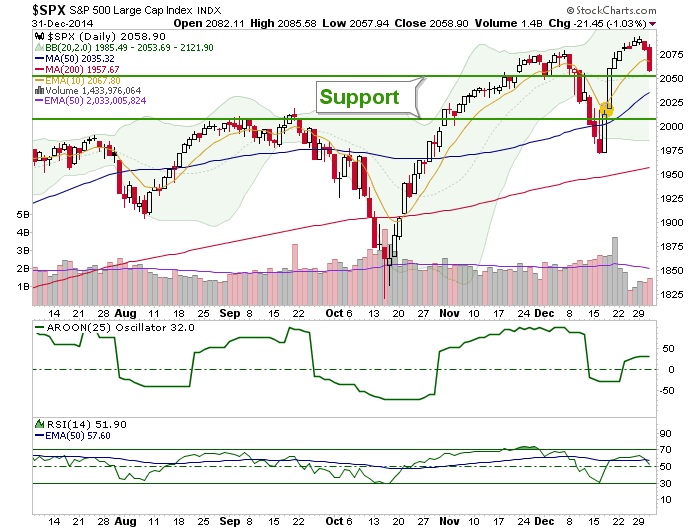
Like the RUT, the S&P500 is in good shape relative to some other indexes. It is just above short-term support at 2050, where it may try to bounce, but there is a gap above 2000 that can easily fill (note that on the SPY ETF the gap is much more pronounced).
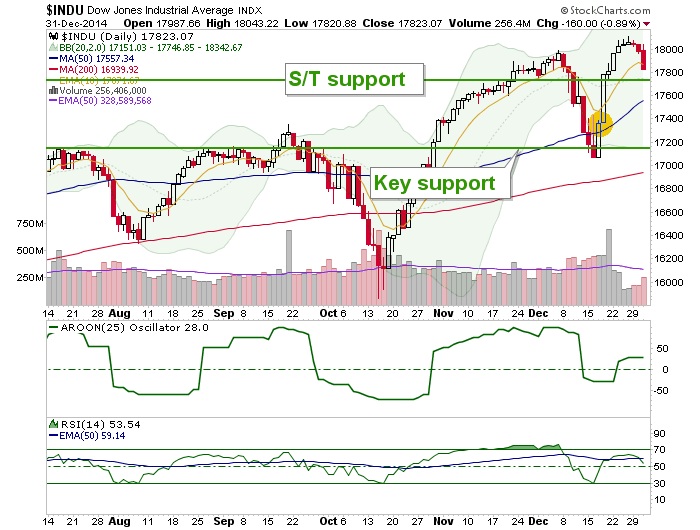
Finally, the venerable one; the Dow shows no gap but again, the DIA ETF shows a huge one. There’s a virtual gap down there from the post-FOMC hype. Dow has some short-term support but if it loses that level, there is a lot of hot air down to the 17,200 level.
Having some time to relax on New Year’s Day, I find it enjoyable to go over these and many other simple nominal charts of US and global markets and of course crashing commodities and the ‘hmmmm, let’s keep an eye on em’ precious metals stocks.
Sometimes I get so caught up in macro data, ratio indicators and all the mechanics whirring along beneath the surface of the market that I forget that simple charting of markets is one of my favorite things to do, going back 15 years or so.
********
Subscribe to NFTRH Premium for your 25-35 page weekly report, interim updates (including Key ETF charts) and NFTRH+ chart and trade ideas or the free eLetter for an introduction to our work. Or simply keep up to date with plenty of public content at NFTRH.com and Biiwii.com.
More from Silver Phoenix 500


