Global Economy Propped Up By US Shale Oil Ponzi Scheme


Few analysts realize that for the past decade, the global economy has been propped up by the U.S. Shale Oil Ponzi Scheme. Without the huge increase in U.S. shale oil production, the global economy would have peaked and collapsed into a severe depression. And according to the new data put out in the 2019 BP Statistical Review, of the total global oil production increase in 2018 over 2017, the United States accounted for a stunning 84% of that growth.
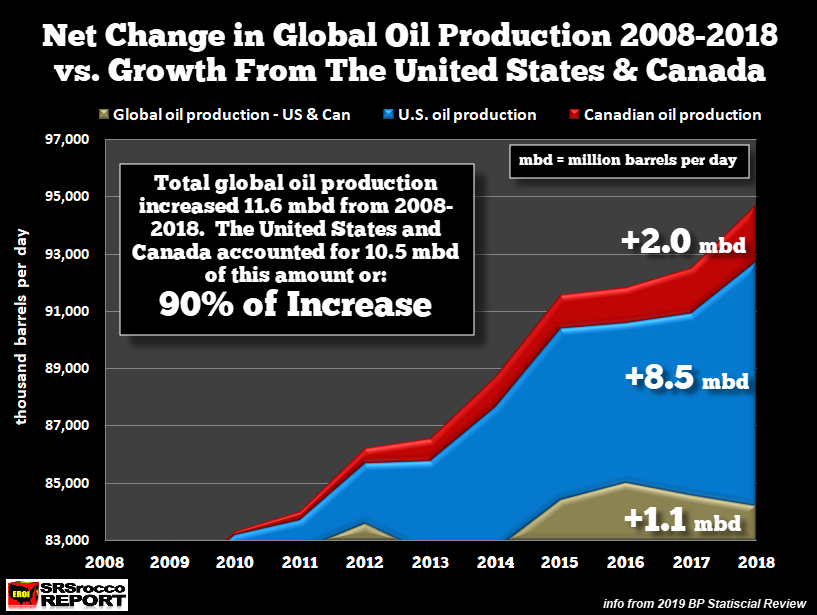
I first wrote about this subject in my article, Global Economic Growth In Serious Trouble When U.S. Shale Oil Peaks & Declines. However, since that article, the new 2019 BP Statistical Review was published on June 11th. I took the data and updated my charts to show that the United States and Canada accounted for 90% of global oil production growth since 2008:
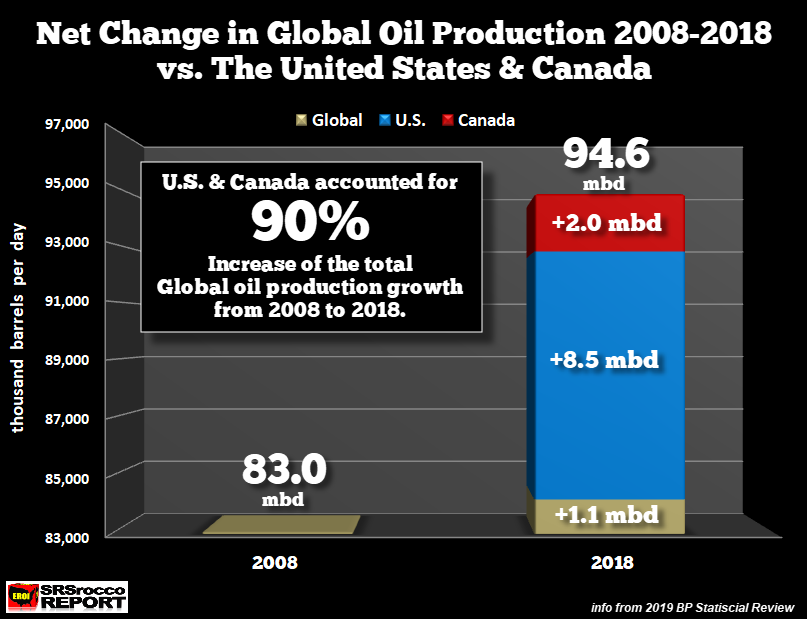
As total world oil production increased by 11.6 million barrels per day (mbd) since 2008, the United States accounted for 8.5 mbd, Canada 2.0 mbd, and the rest of the world 1.1 mbd. If we look at the net increase of global oil production versus the U.S. and Canada during the same period, this is the result:
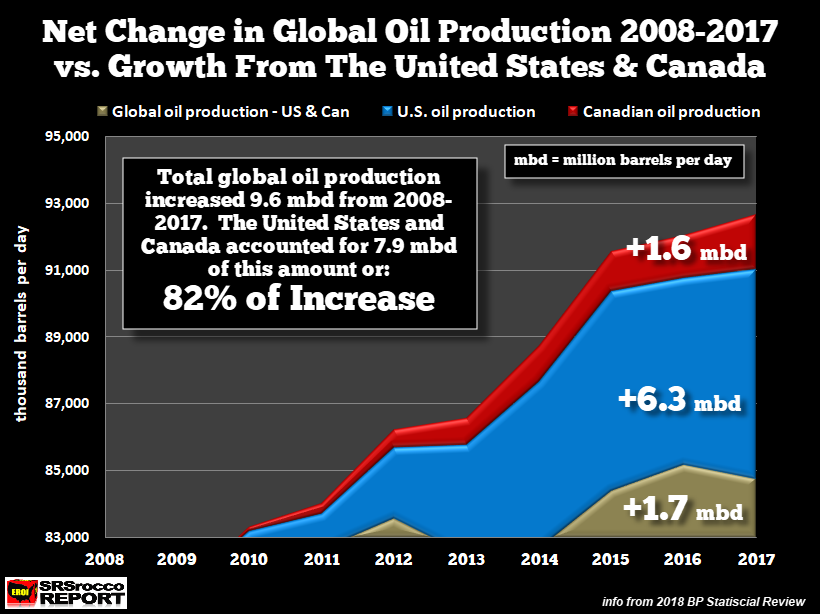
Now compare this updated chart to the data for 2017:
Total U.S. oil production in 2018 increased by 2.2 mbd while Canada added 0.4 mbd, and the rest of the world lost 0.6 mbd. And if we look at the change in Global oil production minus the U.S. and Canada since 1997, it seems as if the rest of the world is dealing with the ramifications of PEAK OIL.
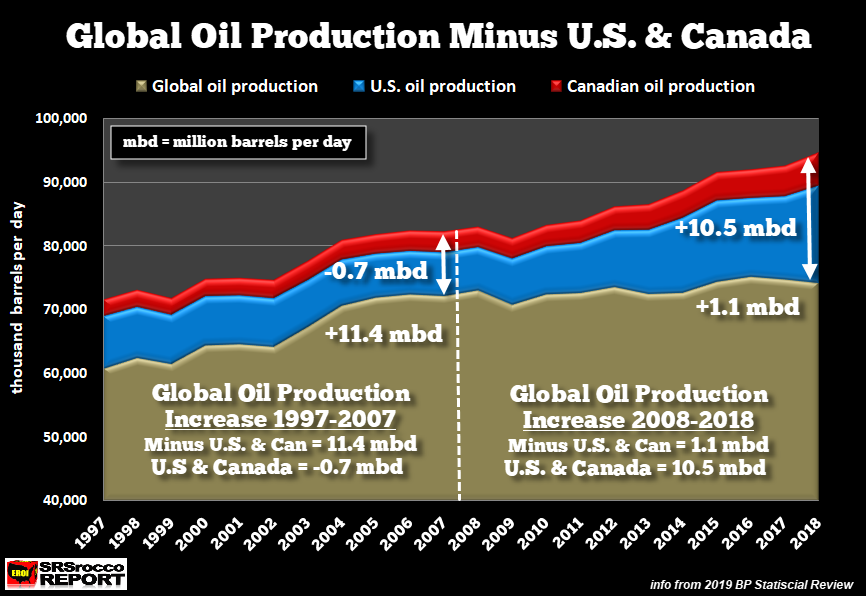
From 1997 to 2007, global oil production growth minus the United States and Canada was 11.4 mbd. However, since 2008, the rest of the world has only added a net 1.1 mbd of new oil production growth vs. 10.5 mbd from the United States and Canada. Thus, North American oil production growth, especially from the U.S., has been the leading factor for Global GDP Growth.
For those who don’t believe that oil production (consumption) has anything to do with Global GDP growth, you need to look at the following chart by Gail Tverberg at OurFiniteWorld.com:
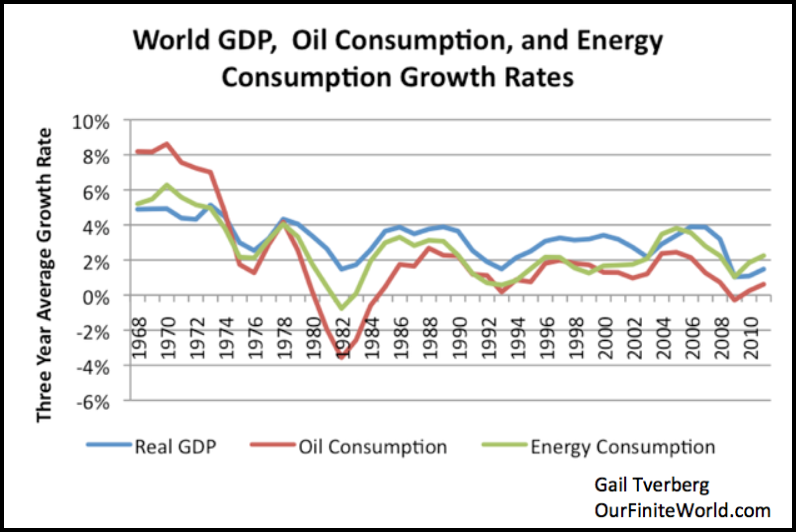
Here we can see that oil consumption rates correspond with the change in Real GDP growth. So, if we consider that the United States accounted for nearly 75% of total world oil production growth since 2008 (check figures below), then it also attributed to approximately 75% of Global GDP growth during the same period.
Breakdown in the oil production growth from the United States, Canada, and rest of world:
Net change 2008 to 2018 Oil Production Growth:
U.S. oil production growth = 8.5 mbd (73%)
Canadian oil production growth = 2.0 mbd (17%)
Rest of world oil production growth = 1.1 mbd (10%)
While the U.S. has added a lot of oil production since 2008, that wasn’t the case in the previous decade:
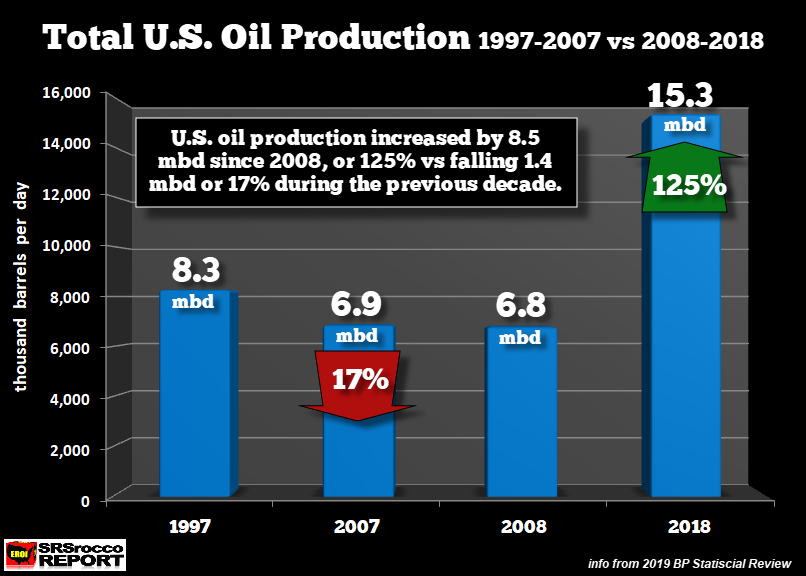
From 1997 to 2007, U.S. oil production fell by 17%, but surged 125% during the recent decade. Even though the BP Statistical Review posts 15.3 mbd of oil production for the United States, that also includes Natural Gas Plant Liquids (NGLS). According to the EIA, U.S. Energy Information Agency, total U.S. NGLs production for 2018 was 4.3 mbd, or 28% of total oil production:
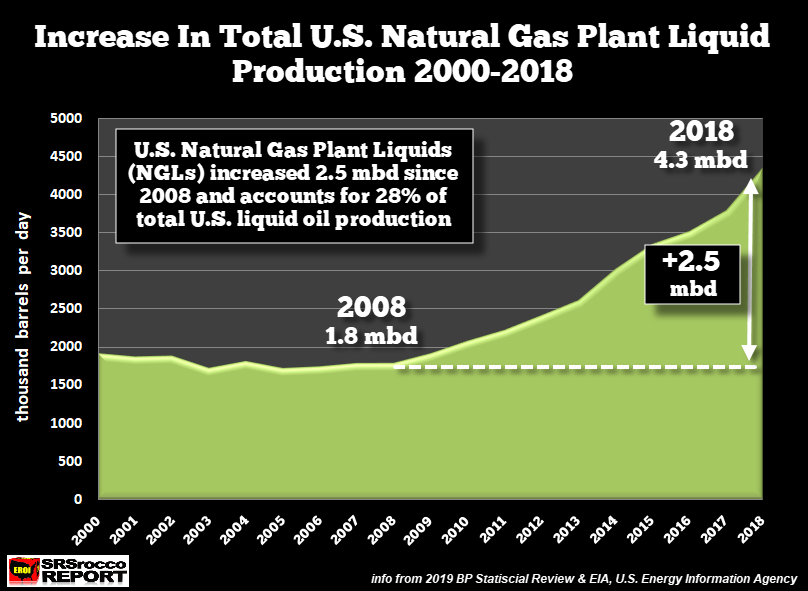
Due to the rapid increase in U.S. shale oil and gas production, a great deal more NGLs are produced. Unfortunately, a barrel of NGLs only contains two-thirds the energy content compared to a barrel of oil and receives a market price that is 60% less than oil. Thus, the 15.3 mbd of total U.S. oil production quoted in the 2019 BP Statistical Review, is actually 11.0 mbd of crude and condensate plus 4.3 mbd of NGLs.
Regardless, the U.S. Shale Oil Ponzi Scheme has allowed the Global Economy to continue growing this past decade, despite the massive amount of debt added to the system. However, U.S. shale oil production will likely peak much sooner than energy analysts are forecasting, especially during the next economic downturn and recession (depression).
Lastly, I will be posting a new article showing that U.S. shale oil production has DECLINED during the first few months of 2019. With oil prices now in the low $50’s, shale oil companies are struggling to continue producing oil at a loss. If oil prices don’t recover back to the high $ 60’s or $ 70’s, watch for growth forecasts in U.S. shale oil to be cut back considerably this year.
********
More from Silver Phoenix 500


