Gold Technicals Improve And Silver Leads


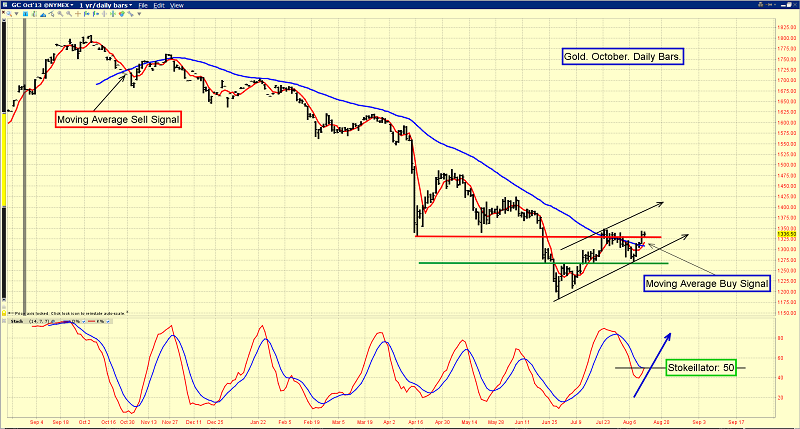
The technical outlook for gold, silver, and mining companies continues to improve. That’s the daily gold chart, and it looks excellent.
First, note the position of my stokeillator (14,7,7 Stochastics series), at the bottom of the chart. The lines are touching, and close to generating a key buy signal.
Furthermore, this potential buy signal is occurring with the lead line near the 50 level, which is where powerful momentum-based price rallies can begin.
Note the action of the moving averages (MA). For intermediate term moves, I like to focus on the 50,5 MA series. A moving average sell signal occurred last fall, with gold trading near $1700.
Finally, over the past two days, a moving average buy signal has been generated.
There is powerful sell-side HSR (horizontal support & resistance) in the $1320 - $1350 area, but these technical buy signals are beginning to attract the attention of analysts at major banks. The technical “fuel” to move gold above $1350 is now in the market.
Silver is a particularly interesting commodity right now. The April & June declines took silver below where it was trading before quantitative easing began.
The Fed has been very clear that it remains committed to stimulus and to a low interest rate environment. In my professional opinion, the price of silver should not be trading now, below where it was when QE started. I think silver traders overreacted to “taper time” talk, and a sizable rally is very likely.
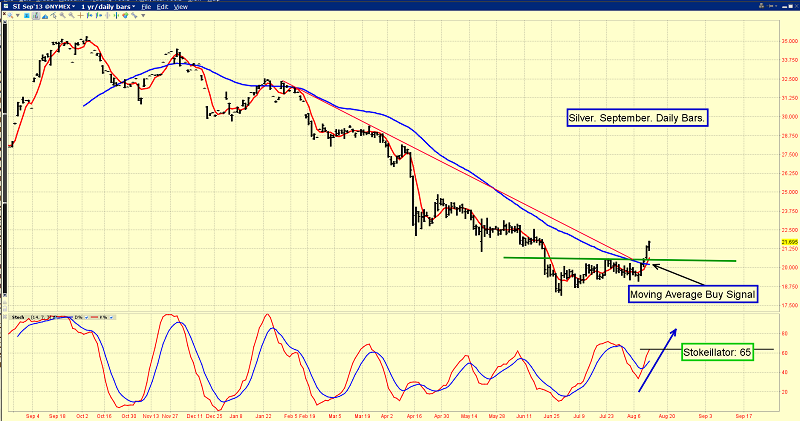
You are looking at the daily chart for silver. My stokeillator is flashing a strong buy signal, and so is the 50,5 MA (moving average series).
Silver and gold stocks can be good leading indicators for the gold price. Over the past two days, silver has traded well above its July highs.
The July highs in the $20.50 area have now become buy-side HSR. Momentum-oriented traders will likely be taking note of the improving technical situation for silver, and placing buy orders.
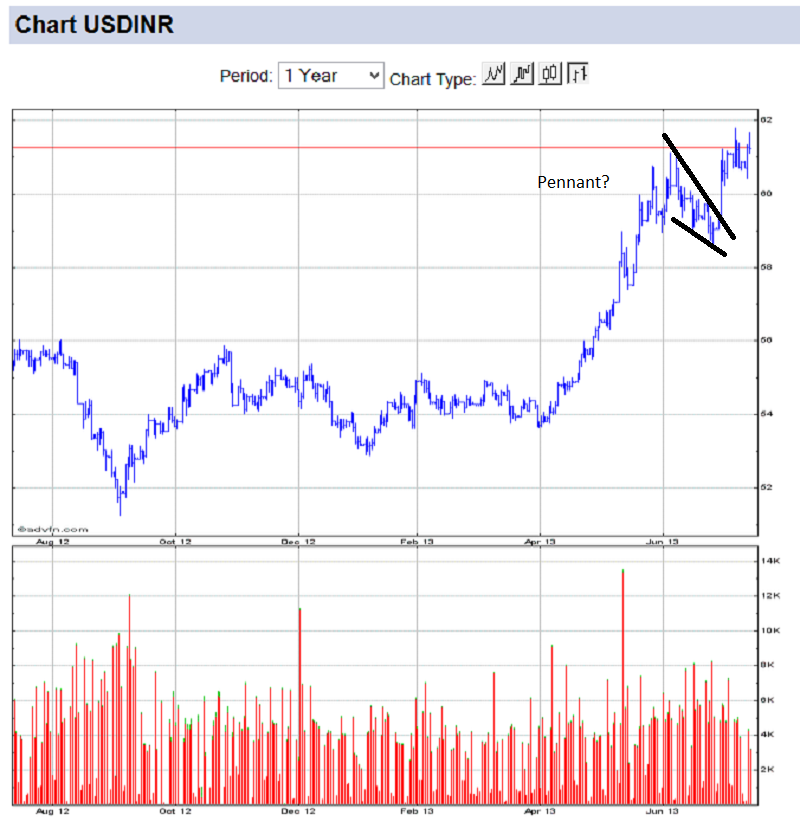
There is no free ride in markets, and gold is no exception to that rule. That’s a daily chart of the US dollar versus the Indian rupee. Unfortunately, the dollar has surged to another new high.
India’s government and central bank have enacted very tough gold import rules, to combat the strength of the dollar, but so far, that’s not working.
The Indian government blames gold imports for the CAD (current account deficit), because gold is bought with US dollars rather than with rupees. There are rumours that stronger rules are coming, and those rules could also extend to the silver market, to prevent substitution.
I think it will take about a year for the Indian current account deficit to stabilize. QE tapering is likely already factored into the gold price by most institutional traders, so the rupee chart is the only really negative factor that I see for gold, at least for the next few months. In the intermediate term, the bulls seem ready to dominate the bears.
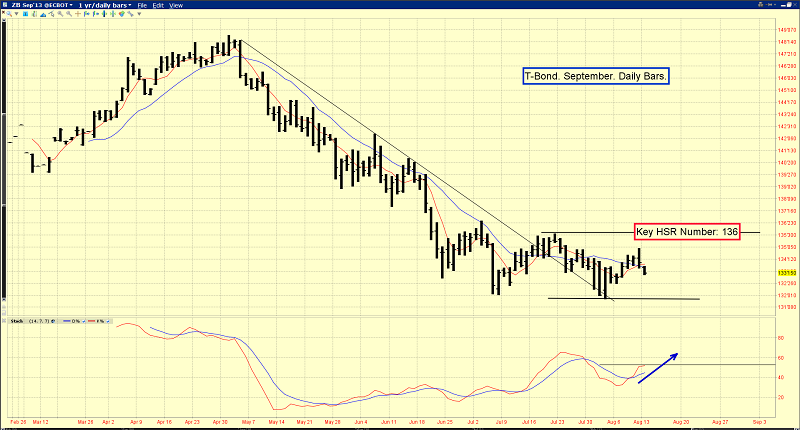
The daily T-bond chart is slightly concerning, but only on a very short term basis. I don’t think Ben Bernanke has “lost control” of the bond market at all. If he had lost control, the dollar wouldn’t be drifting lower. It would be crashing. Bonds would also be crashing, and that’s not happening.
Take note of the 136 level on the T-bond chart. If bond prices can move above that, it could help gold surge towards $1400. The T-bond stokeillator looks good, and the stock market is entering “crash season” (September – October), after a multi-year advance that has attracted a number of retail investors.
A bond market rally is very probable in this environment, as “smart money” institutional managers look to lock in stock market profits.
There’s more good news for commodity bulls. Reuters News reports this morning that China’s gold buying exceeded 700 tons in the first six months of the year, which is an increase of about 50% over last year.
Also, the nation recently stunned most analysts, with the release of commodity demand statistics for July. Instead of falling, Chinese demand for oil went to an all-time high.
Clearly, the industrialization of China continues, and that’s great news for commodity investors.
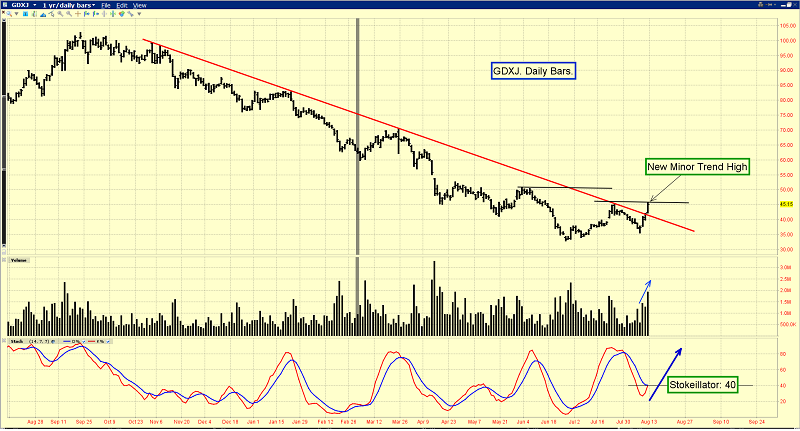
That’s the GDXJ daily chart, and it’s arguably the most exciting chart in the metals sector right now. Since the highs in the $100 area occurred last September, no GDXJ rally could exceed a previous minor trend high. That situation changed yesterday, with the move to $45. Good volume accompanied the price surge. The red downtrend line has been penetrated, which is bullish.
A lot of investors are looking for “the bottom” in gold stocks. Unfortunately, I don’t think that’s a very profitable approach to the market. A rally seems likely here, and it’s arguably already underway, but as 2014 (and real QE tapering) approaches, bank analysts could turn very negative on commodities, and particularly on gold.
It’s very dangerous to assume that precious metal assets will never trade below certain levels in your lifetime. From their recent lows, many junior gold stocks are already up 50% - 100%. Professional investors are booking profits now, while amateurs begin to draw arrows to price targets that are surreal, but emotionally satisfying. If you were able to buy into the recent gold stock carnage, even in a tiny way, it’s important to have a profit-booking mindset now, as price goes higher!
Special Offer For Gold-Eagle readers: Send me an Email to freereports4@gracelandupdates.com and I’ll send you my free “Gold Explorers Reverse Split; Bullish Or Bearish?” report! I cover the price action of the GLDX ETF, which was recently reverse-split, and I’ll show you where my exact buy and sell points are!
www.gracelandupdates.com
www.gracelandjuniors.com
www.gutrader.com
Email: stewart@gracelandupdates.com
Or: stewart@gutrader.com
Mail to:
Stewart Thomson / 1276 Lakeview Drive / Oakville, Ontario L6H 2M8 Canada
Risks, Disclaimers, Legal
Stewart Thomson is no longer an investment advisor. The information provided by Stewart and Graceland Updates is for general information purposes only. Before taking any action on any investment, it is imperative that you consult with multiple properly licensed, experienced and qualifed investment advisors and get numerous opinions before taking any action. Your minimum risk on any investment in the world is: 100% loss of all your money. You may be taking or preparing to take leveraged positions in investments and not know it, exposing yourself to unlimited risks. This is highly concerning if you are an investor in any derivatives products. There is an approx $700 trillion OTC Derivatives Iceberg with a tiny portion written off officially. The bottom line:
Are You Prepared?
 Stewart Thomson is president of Graceland Investment Management (Cayman) Ltd. Stewart was a very good English literature student, which helped him develop a unique way of communicating his investment ideas. He developed the “PGEN”, which is a unique capital allocation program. It is designed to allow investors of any size to mimic the action of the banks. Stewart owns GU Trader, which is a unique gold futures/ETF trading service, which closes out all trades by 5pm each day. High net worth individuals around the world follow Stewart on a daily basis. Website: www.gracelandupdates.com.
More from Silver Phoenix 500


