Have The Stock Bulls Really Sealed The Short-Term Crack In The Dam?


Stocks again made a new intraday 2020 high yesterday, but the bulls were stopped just a point shy of the 3395 mark. Has yesterday’s increase invalidated our reasons to be cautious and take profits off the table? In other words, can we expect the bulls to push through the psychological 3400 level and keep trading sustainably above it?
We’ll start by examining the daily chart (charts courtesy of http://stockcharts.com).
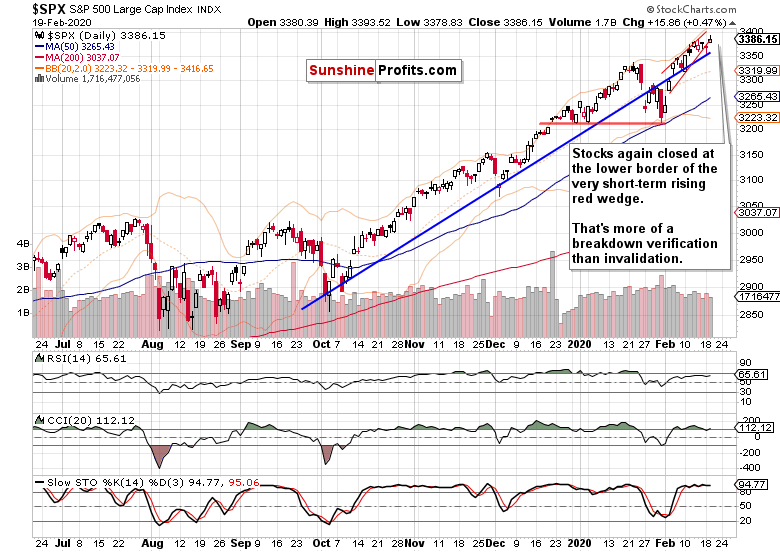
The bulls opened with a sizable gap yesterday, and have been adding to their gains. Before the closing bell however, stocks rolled over to the downside. Relative to the body of the candle, this created a sizable upper knot – that’s a strong sign that the bulls aren’t as strong as they appear to be in the very short-term.
Yesterday’s close is again right at the lower border of the very short-term rising red wedge. For a second day in a row, the bulls have been unable to return trading back inside the wedge. While that’s not apparent in price (yet), it’s a subtle sign of their momentary weakness.
As a result, the case for last two days’ price action being merely a verification of the breakdown below the rising red wedge, just grew stronger.
And what about today’s premarket action? With the S&P 500 futures trading at around 3380 currently, they appear ready to test yesterday’s bullish opening gap with its lower border at 3370 - at a minimum and during one of the nearest sessions.
There’s one more reason why our yesterday’s call of caution to profitably close the earlier long position, is justified. Enter Force Index and the valuable lesson of its divergencies with prices.
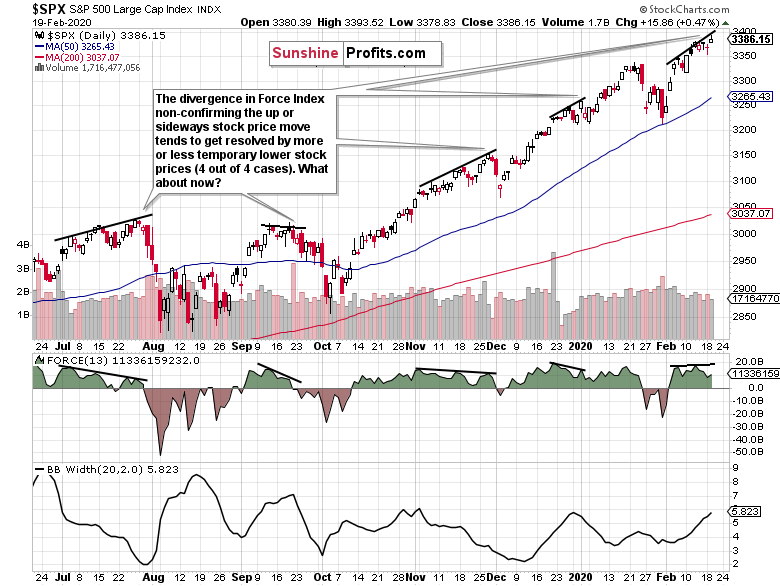
Force Index is a unique type of oscillator, because it’s not built just around prices. It takes into account volume, and that’s its key advantage. How much can we trust a price move that lacks commitment of the bulls (or bears)? Yes, price and volume go hand in hand – it’s plain dangerous to ignore either.
We’ve marked several cases when Force Index has been unable to make new highs while remaining in the positive territory on the above daily chart. Take a good look what have been stock prices doing in the meantime – either scoring new highs, or slowly losing their breath.
And what happened once Force Index declined more noticeably? Prices followed to the downside - on a more or less temporary basis, but nonetheless declined. In all 4 out of the 4 cases examined.
And what about the current setup? Prices are on a slow grind higher, yet Force Index hasn’t overcome its mid-February peak yet. Sure, it looks to be on the upswing currently, and has quite a way to go before challenging that peak.
How likely is it that it would make it there? If it did, that would be similar to its mid-December to mid-January performance, during which stock prices went even higher. Should it be so this time as well, that would mean we get stock prices creeping up for weeks to come, without a sizable correction.
But volatility as expressed by the Bollinger Band Width has recently been rising, and it favors seeing some more of it still. And taking into account all of the above, it’s our opinion that we’re more likely to see some downside move shortly – regardless of whether the bulls take on 3400+ before that, or not.
In other words, the very short-term risks continue to be skewed to the downside.
However, keeping in mind the Tuesday-discussed bullish outlook on the weekly chart, such a downswing would offer us a favorable setup to again enter on the long side and enjoy the gains still ahead in this longest-running stock bull market.
Summing up, the medium-term S&P 500 outlook remains solidly bullish, yet the noticeable signs of deterioration on the daily chart continue to persist. It’s the bulls’ weakness in moving back inside the rising wedge, or the Force Index divergence and volatility examination. Faced with a deteriorating risk-reward prospects, we’ve made the right decision to cash in earlier profits. A move lower shortly appears more likely than not, and it would offer us an opportune setup to get back in on the long side to reap more fruits of this stock bull market. It remains intact and much higher prices are to come. Our aim is to let the many bullish factors in this stock bull market keep working to our benefit – but the risk of short-term downside remains too high to ignore.
We encourage you to sign up for our daily newsletter- it's free and if you don't like it, you can unsubscribe with just 2 clicks. If you sign up today, you'll also get 7 days of free access to our premium daily Stock Trading Alerts as well as our other Alerts. Sign up for the free newsletter today!
Monica Kingsley
Stock Trading Strategist
Sunshine Profits - Effective Investments through Diligence and Care
* * * * *
All essays, research and information found above represent analyses and opinions of Przemyslaw Radomski, CFA and Sunshine Profits' associates only. As such, it may prove wrong and be subject to change without notice. Opinions and analyses were based on data available to authors of respective essays at the time of writing. Although the information provided above is based on careful research and sources that are believed to be accurate, Przemyslaw Radomski, CFA and his associates do not guarantee the accuracy or thoroughness of the data or information reported. The opinions published above are neither an offer nor a recommendation to purchase or sell any securities. Mr. Radomski is not a Registered Securities Advisor. By reading Przemyslaw Radomski's, CFA reports you fully agree that he will not be held responsible or liable for any decisions you make regarding any information provided in these reports. Investing, trading and speculation in any financial markets may involve high risk of loss. Przemyslaw Radomski, CFA, Sunshine Profits' employees and affiliates as well as members of their families may have a short or long position in any securities, including those mentioned in any of the reports or essays, and may make additional purchases and/or sales of those securities without notice.
********

Monica Kingsley is a trader and financial markets analyst. Checking dozens of charts daily, she integrates their messages with economics and in-depth experience. Trade calls and writing are her cup of tea as much as studies in market histories. Having been at the financial markets when the Great Recession arrived, she experienced many bull and bear markets - be it in stocks, bonds, gold and silver. https://www.monicakingsley.co


