History Says You Have 27 Days To Buy Silver Before It Rises
 share
share
 share
share
 share
share
 share
share
 share
share
Mike Maloney revealed that he recently made a large purchase of silver because of how undervalued it is. And he bought silver instead of gold because of how high the gold/silver ratio is.
If you want to mimic Mike’s purchase of silver while it’s still undervalued, history says you only have 27 days to do so.
As many of you know, the gold/silver ratio (the price of gold divided by the price of silver) has touched 80 a number of times over the past 25 years. And it’s never stayed there long. History shows this is the level at which silver is grossly undervalued compared to gold. Sooner or later the ratio falls to account for the large discrepancy between their prices.
Here’s an updated view of the gold/silver ratio since 1995, along with silver’s gains after the ratio reversed from 80.
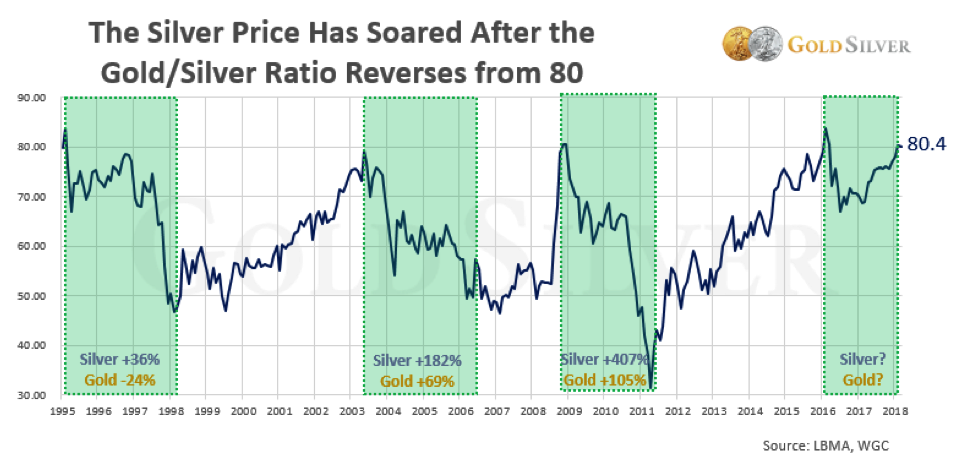
You can see how much silver has outperformed gold when the ratio falls. And that some of those gains have been big—two of them were measured in triple digits.
You can also see that after dipping below 70 a couple times over the past two years, the ratio has returned to the 80 level (80.4 as of March 5). This pattern is similar to what it did in 1996. And in spite of a ravaging bear market in precious metals at that time, silver gained 36% over the next 14 months.
But something else sticks out in the chart: The gold/silver ratio has never remained above 80 for very long.
This is significant if you’re a buyer because it means that the historical window to purchase silver at an undervalued price compared to gold has been small.
Here’s the same chart with the number of days the ratio stayed above 80 before reversing.
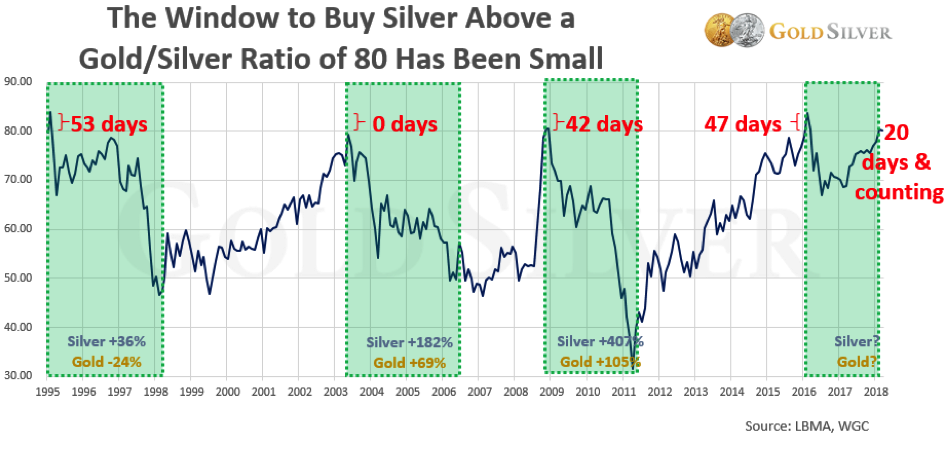
You can see that the number of days one has been able to buy silver while the ratio is above 80 has been few. And this is calendar days, not trading days. This is highly actionable information.
Since 1995, you can see there have been three occasions where the ratio registered at or above 80. The average of those days is 47. As of March 5, the ratio has been at or above 80 a total of 20 calendar days—so if it met the historical average this time around, you’d have 27 calendar days left to buy before the ratio drops.
In other words, you’d have until April 1 to buy silver before the price potentially moves higher (the ratio could also move lower if silver fell less than gold, but the price is already low).
The ratio could drop sooner or later than 27 days, of course. The point to this exercise is that the ratio has historically remained above 80 for only short periods of time. Thus, the opportunity to buy silver while it’s cheap is likely going to be brief.
And April Fools Day has some significance to precious metals: It marked the very bottom of the bear market in 2001 (a Sunday), and the beginning of the second biggest bull market in modern history. Those who scoffed at gold and silver then because of their low prices ended up being the fools.
History shows the silver price has logged some very nice gains when the gold/silver ratio reverses. Any time it has hit the current level, its stay there has been short-lived.
The conclusion is simple: Buy silver now, because the ratio says it is unlikely to remain at these prices for long.
*********
share
share
share
share
share
More from Silver Phoenix 500


