Last Week’s Shallow Drop In Stocks Portends Bigger Drop Ahead


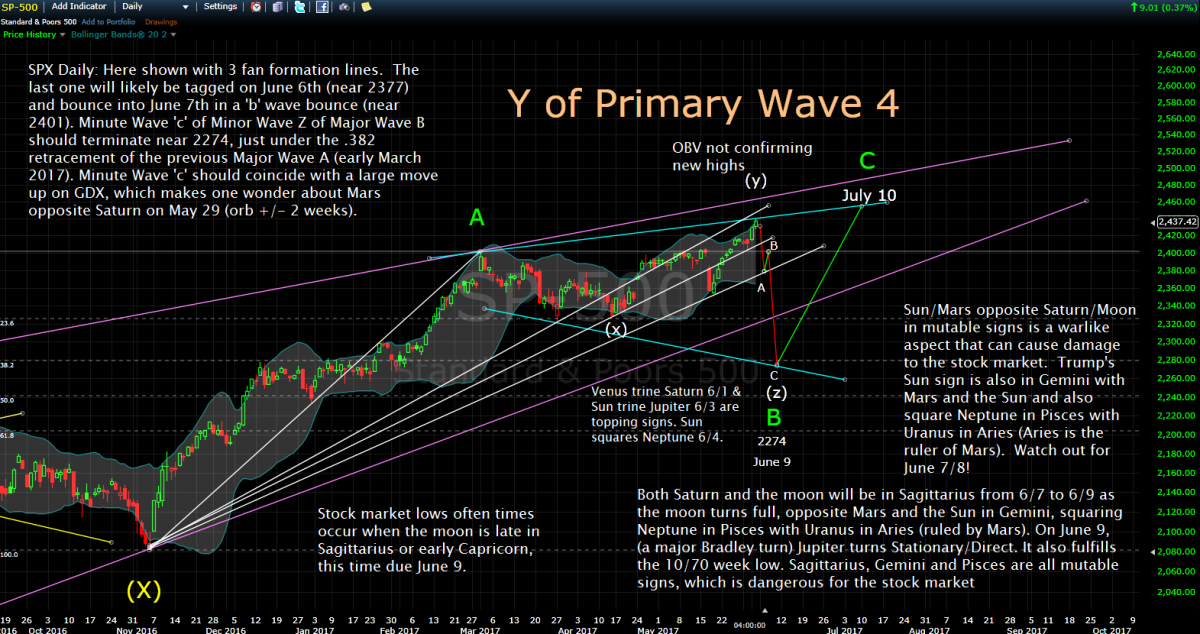
Last week I was looking for a pull back into May 31’s 8 TD low. Howeve, the move down was extremely shallow (wave ‘b’ 2418 down to 2403) -- and wave ‘c’ of Y looked to have finished on June 2 (or will finish by June 5 near 2440). The trines of June 1 (Venus trine Saturn) and June 3 (Sun trine Jupiter) are usually found near tops.
On June 3, we have Venus conjunct Uranus in Aries (Mars rules Aries) and then the Sun squares Neptune in Gemini-Pisces June 4 while the Mars opposition to Saturn (May 29) orb still influences about two weeks out (through the end of next week). Mars leaves Gemini the same day and enters Cancer.
On June 5, the moon enters Scorpio (rued by Mars and Pluto), typically a day when the market tops and falls into the Sagittarius moon. The moon will be in harmony to Mars and Neptune until June 7th. On June 6 to 7, Mercury enters Gemini, conjuncting the Sun, but opposite Saturn and later the moon (a lot of conflict in mutable signs, not good for the stock market).
On late June 7th, the moon leaves Scorpio and enters into Sagittarius (conjuncting Saturn) opposing the Sun (squaring Neptune) and Mercury. By the full moon of June 9 we have Jupiter in Libra (opposite Venus and Uranus) turning stationary/direct.
This is a lot to chew on I know, but the implications are enormous. According to the e-wave count, the coming 10/70 week low (due ideally June 7 +/-) and the Saturn/Uranus trine topping influence (until about July 10th) as well as the chart of GDX, I believe I have the found the correct e-wave count (I was amiss on the correct count last week, I do apologize).
Currently, the On Balance Volume readings on the SPX and SPY do not confirm the late May top (over the March 2017 or mid May tops) nor the June 2 top over the late May top. Price momentum confirms a higher high yet to come (July 10?), but not the volume-money flow momentum. This means selling pressure is increasing on down days and buying pressure is decreasing on up days. May 31-June 2 showed the worst of the OBV negative momentum, giving us a hint that the stock market is about ready to drop, and drop hard and fast (I believe the May 31-June 2 rally was a sucker’s play).
The last Bradley turn was due June 1 +/- and the next is due June 9th. The next 8 TD low is due ideally early on June 12. There is a 4 TD low (wave ‘a’ of Z of B) due Tuesday June 6 and a possible ‘b’ wave top due on Wednesday, which leaves the dreaded ‘c’ of Z drop (an Elliott third of a third) between June 7 and June 9. By June 12, the moon will have already left Sagittarius and Capricorn (where the lows are generally found). The full moon is a reversal signature and so is Jupiter stationary/direct (my guess based on all this is that the FED will not raise rates in June).
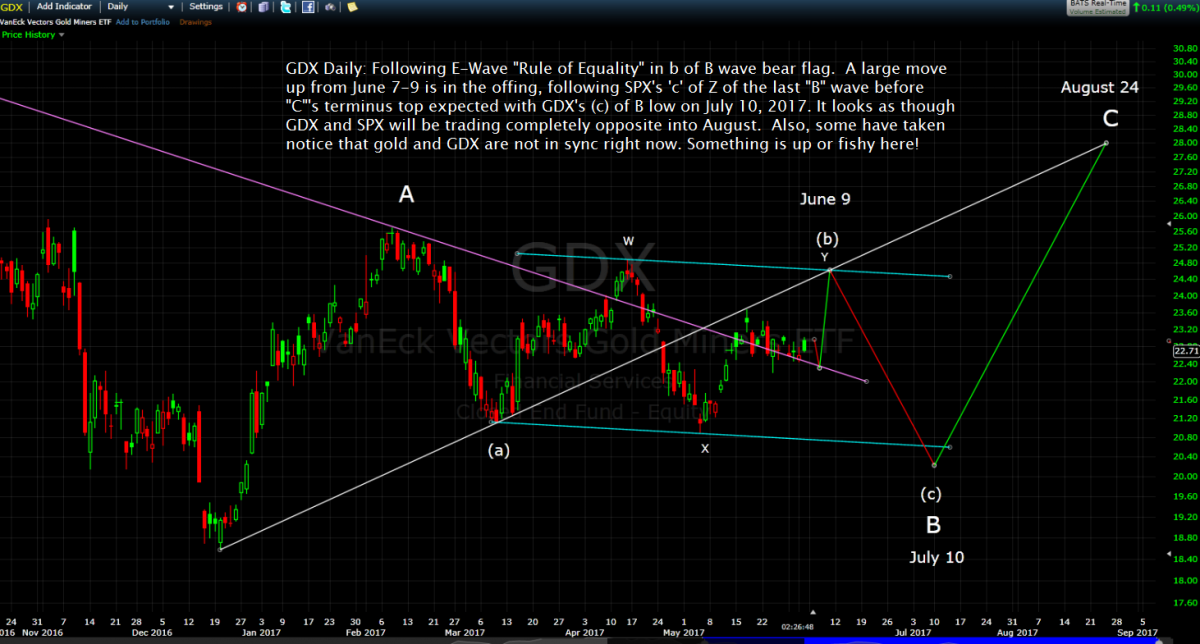
A large rally from June 9th to July 10th is likely with new highs perhaps into the 2450’s or 2460’s. My best guess is we see around 2274 SPX (see charts below) on the coming drop next week (down about 6.8%). I see is a sudden sharp move up (9.8%) on GDX from June 7 to 9 (see chart below), which has me concerned that something sudden like a military strike or act of violence is about to take place (I mentioned this last week).
When all the dust is settled, the traders will see this as an opportunity to buy yet another dip. After July 10, we have the Sun conjunct Mars in Leo on the 26th of July (which in the past has pointed to a 10%+ correction) surrounding this aspect and again Mars in Leo conjuncts the Sun eclipse over America on August 21 (which incidentally will come right over my house for 2 minutes and 30 seconds of complete darkness, I live 20 miles north east of Nashville, TN).
If the mining shares continue to trade opposite the stock market, then I believe August 24th will be the big correction low (or close). August 21 will be exactly 50 trading days from the expected June 9 low (which will be 52 TD’s from the March 27 low). The ten week lows run about 50 TD’s +/- 6 TD’s. The August low will be the 10/20/40 and 80 week low (1.5 year) from Feb 11, 2016.
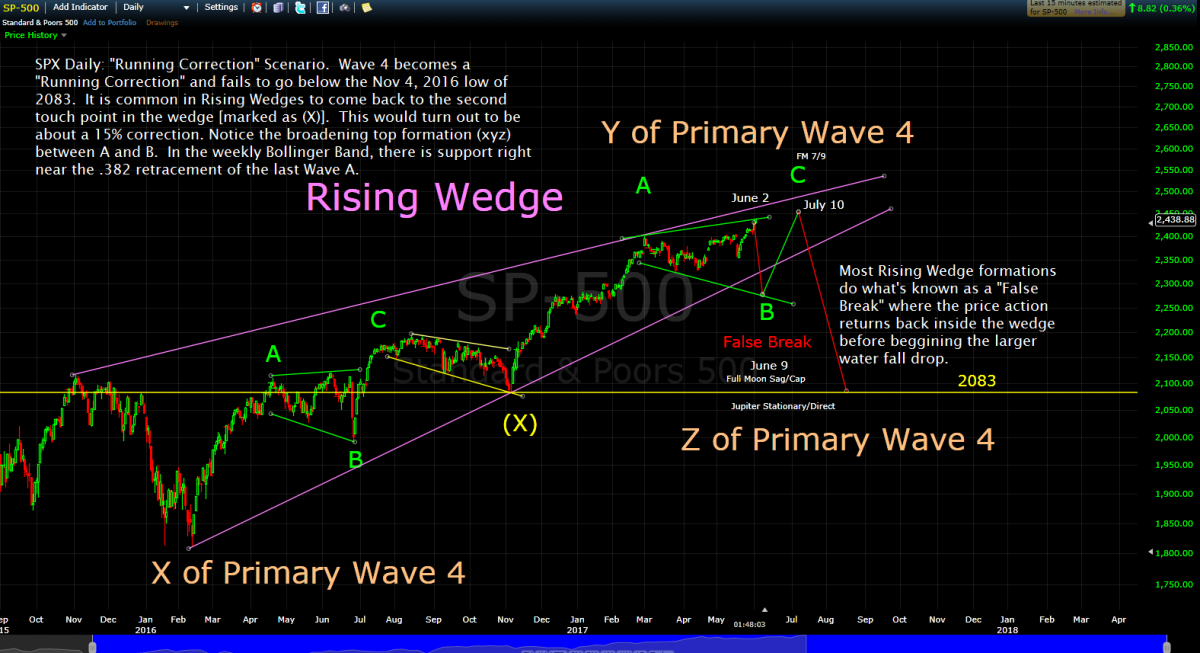
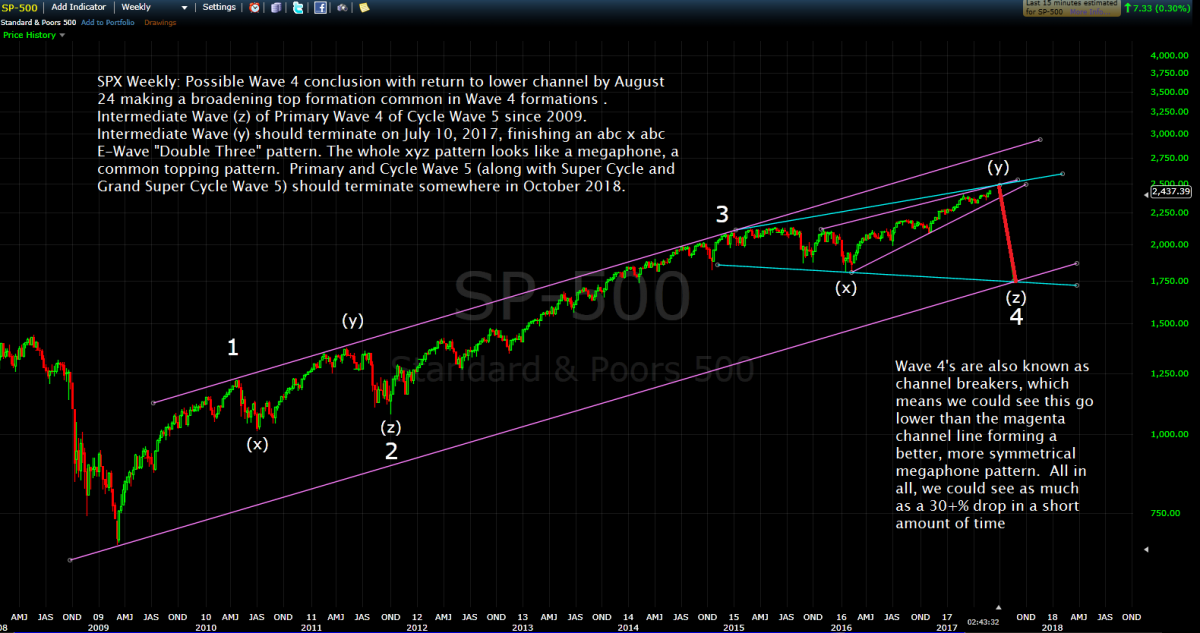
I have given two possibilities as to how low the stock market will drop into the summer. My best guess is, we see a mild Running Correction of around 15%. My thinking is based on the fact that Intermediate Wave Y of Primary Wave 4 went so far above the previous Primary Wave 3 (around SPX 2073, Nov 2015) and the Rising Wedge formation, which usually predicts a drop back to the second touch point ends at 2083. I can say with confidence that all of the Trump rally will be wiped out by August 2017. What I can’t say for sure is if the Wave Z of 4 drop will terminate at 2083 or not. IF the SPX breaks the area between 2073/2083 SPX, then I fear we are in for something bigger on the down side, like down into the 1700’s (see weekly chart below) to finish Primary Wave 4.
The chart of GDX shows a move up from the 20.40/.50 area on July 10 to the 28.00 area by August 24 (based on the Equality of Wave Principle and lines of resistance). This amounts to about a 38.5% move up (GDX and NUGT players take notice!). I would think that if the stock market were to take a bigger hit than 15%, (and GDX was moving opposite the market due to fear) that the GDX move would be substantially higher than 38.5% by August 24th. It all remains to be seen.
The Mars placements in the charts in July/August are definitely warlike (or possibly just saber rattling), but in any case enough to cause fear in the markets. I believe the USA will likely be involved and possibly Iran or North Korea (or both). At this point, it is pure speculation on my part, so I leave the decision to fate.
Again, I caution investor/traders that the opinions here are just that: opinions. There are times when the forecast becomes clear and amazingly accurate. However, there are other times when the waters become murky, making it harder to see. Each day brings new information to analyze, which allows one to trade the markets more effectively.
Website Subscription: www.blustarmarkettimer.info
Blogsite: www.blustarmarkettimer.com
More from Silver Phoenix 500


