Let Your Own Eyes Interpret This Chart


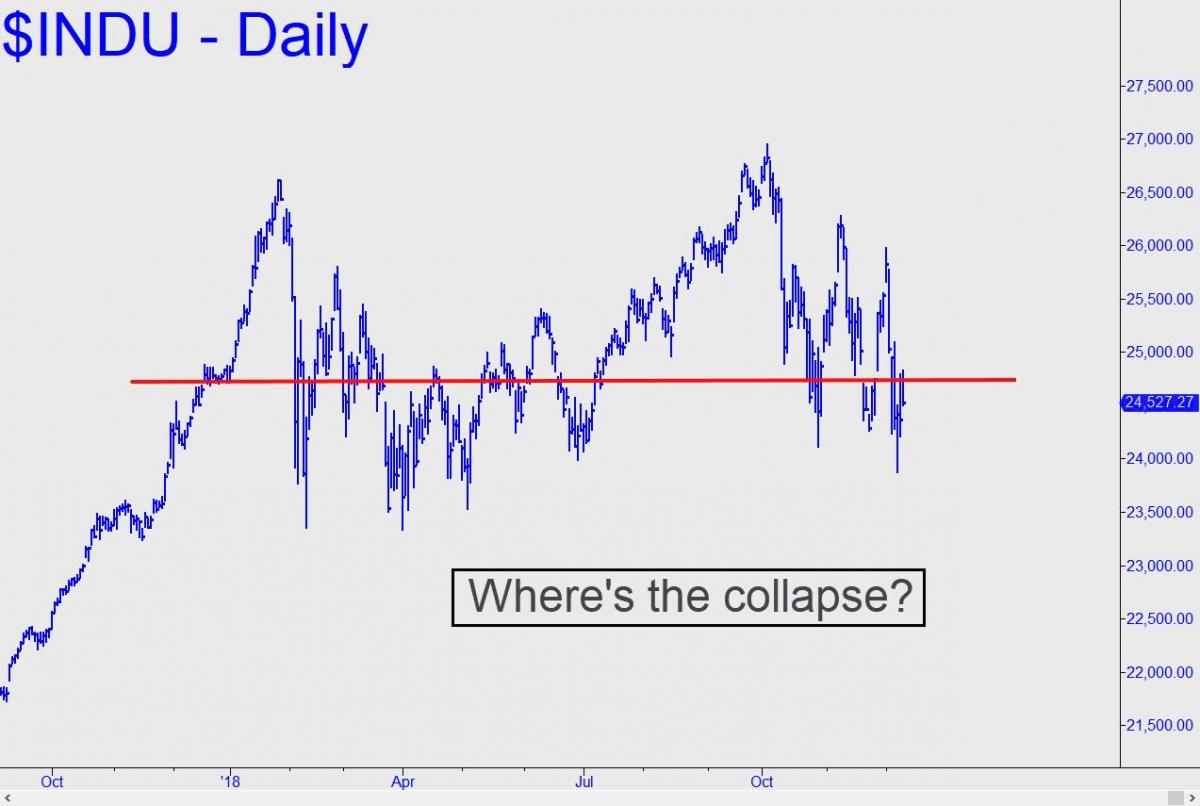
Although stocks have taken an unpleasant hit since early October, the market is not exactly falling apart. Let your eyes take in the big picture shown in today’s chart (inset). It wouldn’t be stretching things visually to say the blue chip average has spent most of the year in a consolidation, presumably biding its time until economic news turns more favorable. In the meantime, one could reasonably infer that shares have held their ground under difficult circumstances, including growing weakness in the housing, automobile and retail sectors.
If AAPL Goes Crazy…
Now try to visualize an imaginary price bar plunging well beneath current levels. It looks ‘wrong’ simply because the eye wants to create symmetry in the chart. In this case, that would mean more pooch-screwing price action similar to what occurred between February and July. While we have much more sophisticated techniques at our disposal to interpret charts, sometimes a visual first impression can give us a good sense of what’s on investors minds. That they have been conflicted during most of 2018 is obvious. But what seems equally obvious is that they may not be quite ready to send stocks into a fearsome plunge below 20,000. Accordingly, Rick’s Picks subscribers have bought a slew of way-out-of-the-money call spreads in AAPL for relative pocket change. I suggested this longshot bet in case traders should do something really crazy and stupid before the year ends. It wouldn’t be the first time.
The foregoing goes directly against my gut feeling that the bull market is over. It also flouts a VXX chart presented here yesterday that suggested volatility is about to spike due to a plunge in the S&Ps. Will the simple picture described above carry the day? We should know soon. If you don’t subscribe but want a peek behind the headlines, click here for a free two-week trial to Rick’s Picks. It will give you instant access to all features and services, including a 24/7 chat room where great traders from around the world share ideas that can help you make money.
More from Silver Phoenix 500


