Magazine Cover Indicator Rears Its Head
 share
share
 share
share
 share
share
 share
share
 share
share
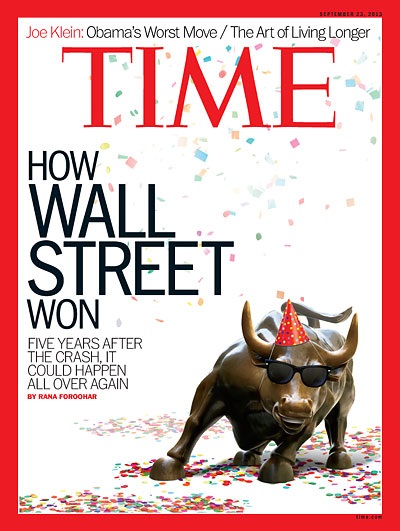
Contrarians take note: The latest issue of Time magazine featured another one of those infamous bull market covers. The bull was displayed rather prominently on the cover under the headline, “How Wall Street Won.”
The cover was clearly celebratory in nature, yet the sub-heading for the article sounded a decidedly cautious note: “Five Years After The Crash, It Could Happen All Over Again.” Normally the Timecover would be interpreted as a contrarian bearish signal for the stock market – a “heads up” warning that a topping process could well be underway with the potential for a sharp reversal in the coming weeks or months. The addition of the proviso about a potential market crash, however, would lead one to speculate that perhaps the somewhat bearish tone of the article cancels out the cover’s implication. One of the pioneers of the magazine cover indicator, Paul Macrae Montgomery, has offered a different spin on the latest Time cover, however. He related to Randall Forsyth in this week’s issue of Barron’s that the cover’s graphic superseded the cautionary message of the Time magazine article.
“If historic probabilities reliably forecast the future, there’s an 80% chance the market will top in a month and will be lower a year from now,” he told Forsyth. Montgomery’s analysis of the latest Time cover jibes with some other recent magazine covers which point to excessive optimism among investors. For instance, the aforementioned Barron’s published a “bull” cover on September 2 under the headline, “The Bull’s In Charge.” The cover featured a smiling, sunglasses-wearing bull holding multiple shopping bags while talking on a cell phone; in the background an angry bear simmers at being left out of the shopping spree.
In last week’s issue of Bloomberg Businessweek the cover featured a picture of the world’s biggest ship being constructed by shipping line Maersk. The cover is significant since record-breaking structures like skyscrapers and ships tend to coincide with peaks in the economy.
To be sure, the magazine cover indicator isn’t infallible and it’s admittedly more reliable, for timing purposes, at bottoms than at tops. Nevertheless, a slew of optimistic magazine covers featuring bulls or other symbols of extreme optimism are common in the weeks and months leading up to major tops. Ironically, the latest Time cover doesn’t present us with a timing tool but it does at least provide a warning that the market could be approaching a top. Take this message with a grain of salt if you must, but keep it in mind as we head into the fourth quarter, especially if the NYSE internal momentum indicators start deteriorating.
Stock market participation in decline
Despite the major indices at new all-time highs, the rate of participation among American investors has been declining. Consider that TD Ameritrade’s Investor Movement Index (IMX) has made a series of lower highs and lower lows since peaking at the beginning of March. During the last 6 ½ months since investor participation peaked according to IMX, the S&P 500 Index (SPX) has gone on to make a series of higher highs. It’s extremely rare that such an extended period of stock market gains coincide with declining participation. Normally new highs in the major averages bring in a flood of new money from investors hungry to get in on the action.
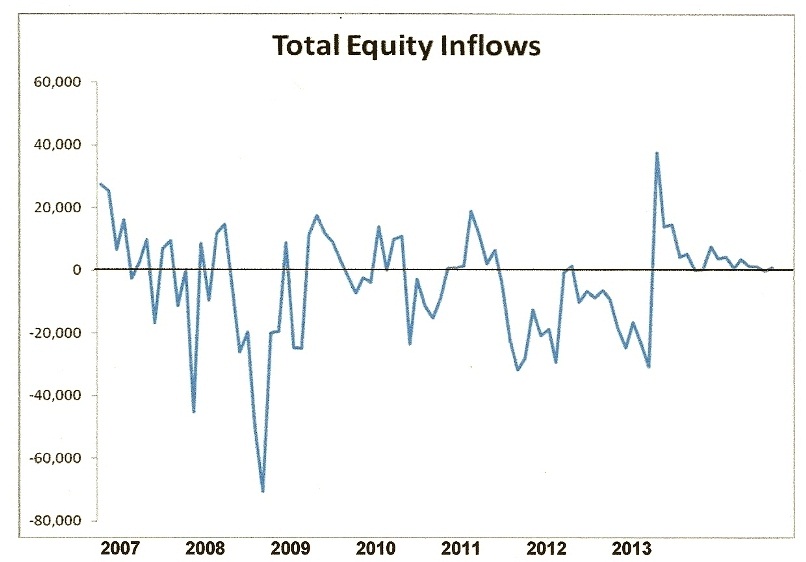
According to the latest data from the Investment Company Institute (ICI), equity market inflows continue to be pretty much non-existent much as they have been in recent months. The following graph shows total inflows to be hovering barely above the “zero” level. If ever there was a picture which captures the complete lack of interest in stocks among the public, this is it.
The principles of contrarianism tell us that stock market tops are unlikely to occur when public interest in stocks is at low ebb. Instead, major tops normally occur when the public becomes highly interested in stocks and has a big stake in the equity market. That certainly was the case leading up to the major tops of the last three decades.
It’s possible that the broad market rally after the Fed announced it would continue QE3 will kindle a revival of interest among retail investors. If so, we can expect to see increased money flows into equities and, in the not-too-distant-future, the corresponding market top that usually accompanies such widespread enthusiasm.
Terrorism and the stock market
This week’s mass shooting episode at a Washington, D.C. naval yard was a sullen reminder that terrorism, for all its horror, normally sees higher stock prices in the days following the event. I’ve often noted this correlation over the years and it’s remarkable how often bombings, shootings or other instance of terrorism catalyze stock market rallies. Perhaps it can be chalked up to the old adage, “Buy when there’s blood in the streets.” I realize this saying is, in its original form, strictly metaphorical and pertains to the financial “bleeding” that follows a crash or panic. But it would seem, unfortunately, that literal bleeding applies to this saying as well.
Personally I can’t understand how Wall Street could be so insensitive to the sufferings of the victims of these violent acts as to use the events as a “buy with both hands” signal. But money is amoral and seldom considers the appropriate response to a national tragedy. Money’s only interest is to increase value whenever it can, regardless of considerations of right or wrong. Thus it came as no shock that stocks were significantly higher in the days following the Navy yard shooting.
Gold
After Wednesday’s (Sept. 18) surprise news regarding the continuation of QE3, the price of gold soared nearly 5% for its best day in four years. The stunning reversal in the gold price caused one of Wall Street’s most respected firms to suddenly shift its near-term outlook for the yellow metal.
Goldman Sachs analysts Jeffrey Currie and Damien Courvalin, who recently published a bearish gold forecast, were forced to revise their near-term outlook after Wednesday’s powerful rally. “The [Fed’s] decision, combined with the upcoming debt ceiling debate, leaves risks to gold prices as skewed to the upside in the near- term, in our view,” wrote Currei and Courvalin in a note to clients, as reported in the Business Insider. Goldman Sachs isn’t the only one with egg on its face as many analysts took a decidedly negative view of the metal in the wake of the Fed’s recent tapering talk.
An interesting test of strength for the SPDR Gold Trust ETF (GLD) is coming up once the GLD price approaches the 137 area where the technically significant 150-day moving average intersects in the daily chart. In the past the 150-day MA has served as either a critical support or resistance level (depending on whether GLD was in a rising or declining trend). As you can see in the following graph, GLD hasn’t been able to successfully penetrate above the 150-day MA this year despite previous attempts.
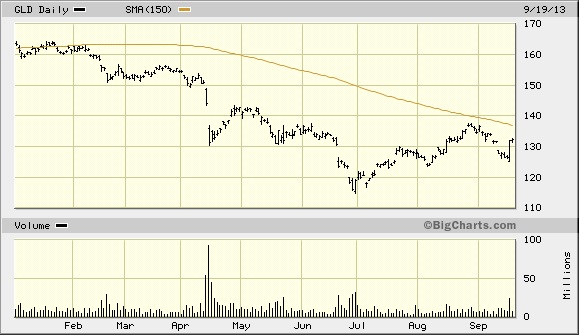
An upside breakout above this key trend line would likely give gold and the gold ETF some additional upside impetus based on short covering since many computers trading programs utilize the 150-day MA in their algorithms.
Quotable
The quote of the week is from Steve Todd of the Todd Market Forecast. Concerning Wednesday’s surprise Federal Reserve move to keep the stimulus intact: “The market is like a prostitute. It likes money and it doesn’t care where it comes from. If we have to pay down the road, so be it.”
High Probability Relative Strength Trading
Traders often ask what is the single best strategy to use for selecting stocks in bull and bear markets? Hands down, the best all-around strategy is a relative strength approach. With relative strength you can be assured that you’re buying (or selling, depending on the market climate) the stocks that insiders are trading in. The powerful tool of relative strength allows you to see which stocks and ETFs the “smart money” pros are buying and selling before they make their next major move.
********
Find out how to incorporate a relative strength strategy in your trading system in my latest book, High Probability Relative Strength Analysis. In it you’ll discover the best way to identify relative strength and profit from it while avoiding the volatility that comes with other systems of stock picking. Relative strength is probably the single most important, yet widely overlooked, strategies on Wall Street. This book explains to you in easy-to-understand terms all you need to know about it. The book is now available for sale at:
http://www.clifdroke.com/books/hprstrading.html
Order today to receive your autographed copy along with a free booklet on the best strategies for momentum trading. Also receive a FREE 1-month trial subscription to the Momentum Strategies Report newsletter.
share
share
share
share
share
More from Silver Phoenix 500


