Mid-Week Charts for Gold, Silver & Oil


So far this week has been very tame as traders are sit on the side lines, waiting to see which way everything will go. I have posted a few charts so we can keep tabs on where gold, silver and oil are currently trading as we go into the second half of the trading week.
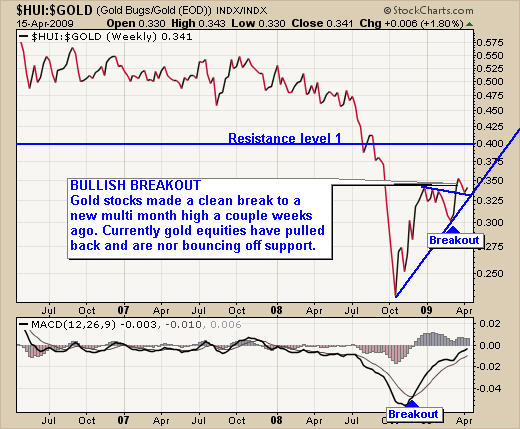
The HUI/Gold ratio
This ratio shows the performance of gold stocks compared to the price of gold. When this chart is moving higher then gold stocks are moving up in price faster than gold.
This chart is starting to show some life again after breaking out and then testing the breakout level with a bounce.
Another great indicator is the Bullish Percent Index for the gold miners which turned up today indicating gold stocks are starting to have money put back into them. This is a bullish indicator for the price of gold.
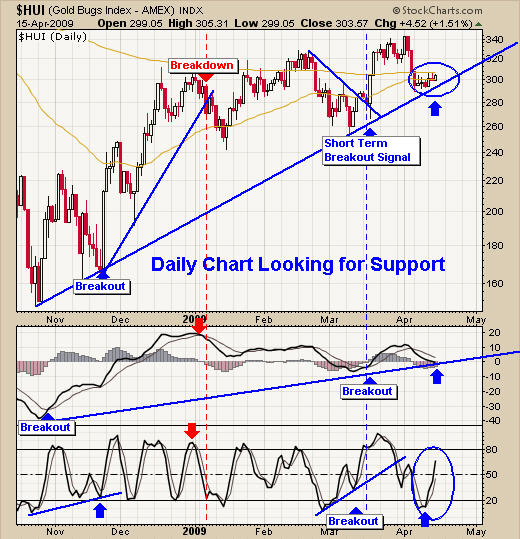
Gold Bugs Index
This chart tracks a large basket of gold stocks. I like to follow this chart closely as it has provided me with buy signals for gold up to 4 days in advance. This is because gold stocks generally lead the price of gold.
Currently the hui is testing support and trying to move above the 200 day moving average. We will watch and see what happens and hope we get a buy signal and setup this week.
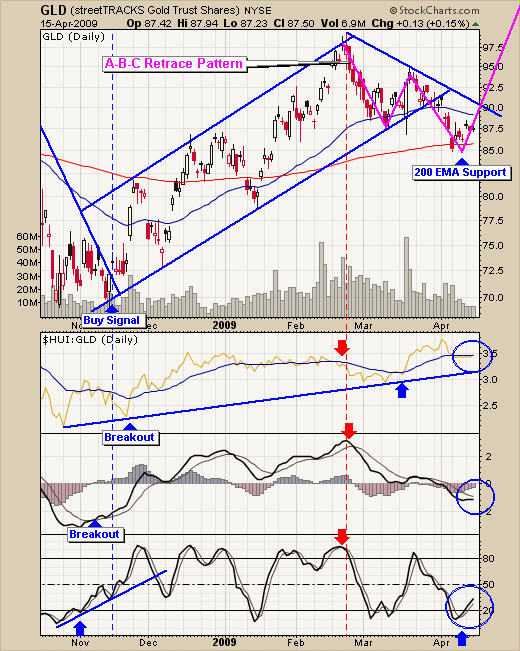
The Price Of Gold (GLD ETF)
Gold continues to hover at the 200 day moving average. Volume has been light the past few sessions as traders wait for some type of rally or breakdown before they put money to work.
I have been getting a tone of emails about this chart because everyone says it's a Head & Shoulders pattern not an A-B-C Retrace.
I completely agree with the head and shoulders pattern but the fact that gold is in a bull market I like to think of it as an ABC or bull flag. Not to mention I think more people are bearish on gold at this level and everyone is seeing the head and shoulders reversal pattern which fuels my continuation pattern even more.
It does not matter which way gold goes, all I am saying is that you must be ready for when the next move happens. I have a feeling we will see prices move quickly.
The Silver Point Of View
Silver has made a huge move during the first 2 months of this year but is now pulling back and flagging similar to the price of gold. Silver is a fast mover and we will keep our eye on this fund for a buy signal and setup in the coming days.

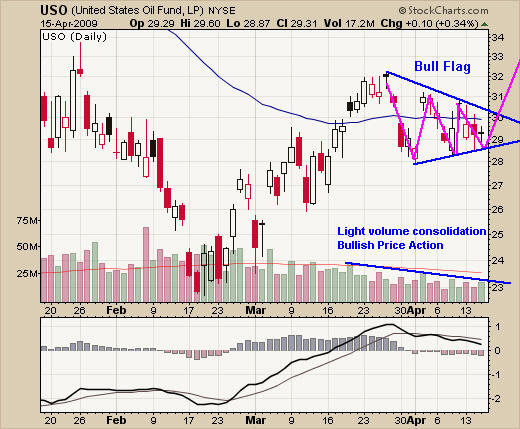
The Oil Point Of View
While this is not crude oil, it is a fund which follows crude oil to some extent. You can see prices have been trapped in this wedge/bull flag. Declining volume indicating this is just a pause before another leg higher. Many of us are long USO from a buy signal & Setup back in February and have locked in some nice profits already. The balance of our trade has a stop at break even currently.
Short Term Trading Conclusion
I think the broad market is over bought at this level and we are due for a sizable pullback any day now. If we see this, then Gold should move higher and becoming the safe haven once again. And I would think silver will follow.
Oil on the other hand is a little different. In the old days when oil went up the markets would go down and vise versa. Now it almost seems like oil moves based on what the broad market is doing.
If the broad market loses value, oil seems to go down with it because the crumbling economy cannot handle any more blood shed and will not support high oil prices. So things are completely different for oil traders. Until the financial system is put back together, a lot of investment vehicles are not trading the way they should be making it much more difficult for participants.
We will continue to watch these commodities and only trade them when we have signals and low risk setups.

Chris Vermeulen has been involved in the markets since 1997 and is the founder of Technical Traders Ltd. He is an internationally recognized technical analyst, trader, and is the author of the book: 7 Steps to Win With Logic
Through years of research, trading and helping individual traders around the world. He learned that many traders have great trading ideas, but they lack one thing, they struggle to execute trades in a systematic way for consistent results. Chris helps educate traders with a three-hour video course that can change your trading results for the better.
His mission is to help his clients boost their trading performance while reducing market exposure and portfolio volatility.
He is a regular speaker on HoweStreet.com, and the FinancialSurvivorNetwork radio shows. Chris was also featured on the cover of AmalgaTrader Magazine, and contributes articles to several financial hubs like MoneyShow.com.
More from Silver Phoenix 500


