More Fluctuations Along New Record Highs, Will Stocks Continue Higher?


Our intraday outlook is bearish, and our short-term outlook is bearish. Our medium-term outlook remains neutral, following S&P 500 index breakout above last year's all-time high:
Intraday outlook (next 24 hours): bearish
Short-term outlook (next 1-2 weeks): bearish
Medium-term outlook (next 1-3 months): neutral
Long-term outlook (next year): neutral
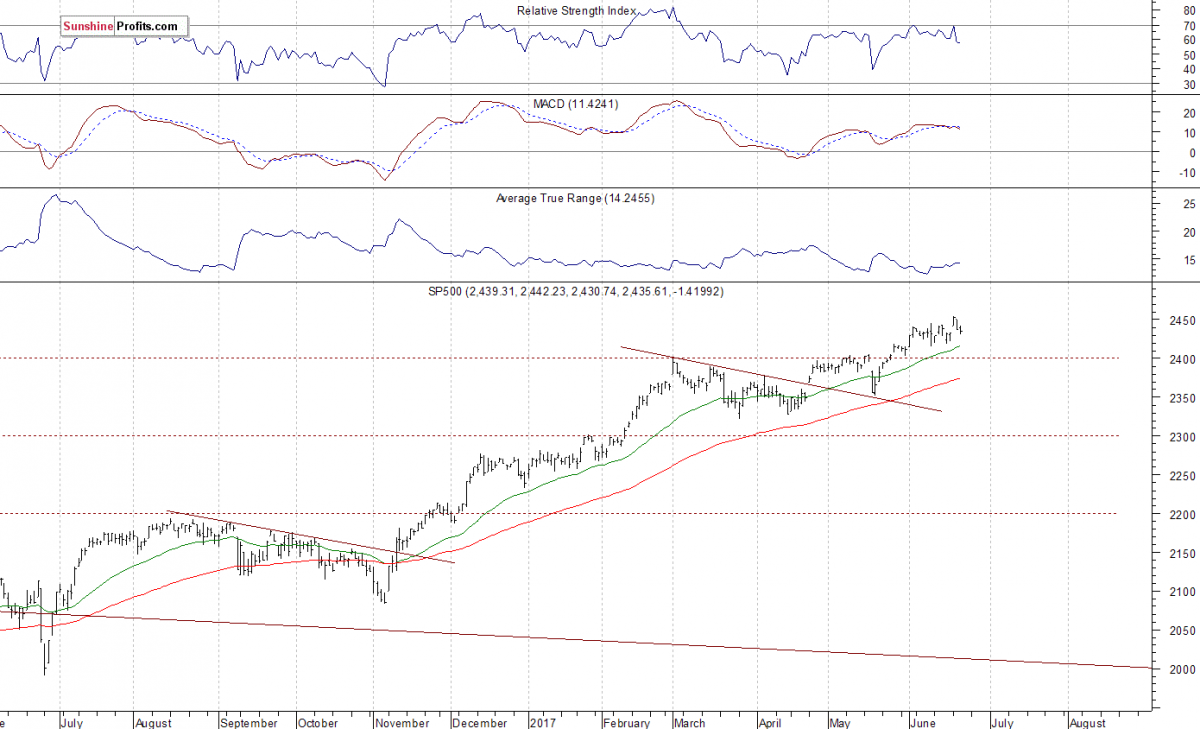
The U.S. stock market indexes were mixed between -0.3% and +0.7% on Wednesday, as investors continued to hesitate following recent volatility. The S&P 500 index has reached new all-time high at the level of 2,453.82 on Monday following breakout above its short-term consolidation along the level of 2,420-2,440. It is currently trading 0.7% below that new record high. Stocks have rebounded strongly after their mid-May quick two-session sell-off and continued over eight-year-long bull market off 2009 lows. The Dow Jones Industrial Average has reached yet another new all-time high at the level of 21,535.03 on Tuesday. The technology Nasdaq Composite was relatively stronger than the broad stock market yesterday, as it gained 0.7%. However, it continued to trade well below its June 9 high. The nearest important support level of the S&P 500 index is at around 2,430-2,435, marked by Monday's daily gap up of 2,433.15-2,441.79. The next level of support is at 2,415-2,420, marked by some recent local lows. The support level is also at 2,400-2,410, marked by the May 25 daily gap up of 2,405.58-2,408.01, among others. On the other hand, level of resistance is at 2,450-2,455, marked by new all-time high. There have been no confirmed negative signals so far. However, we can see overbought conditions and negative technical divergences. The S&P 500 index is trading within its two-week-long consolidation again, as we can see on the daily chart:
More Fluctuations?
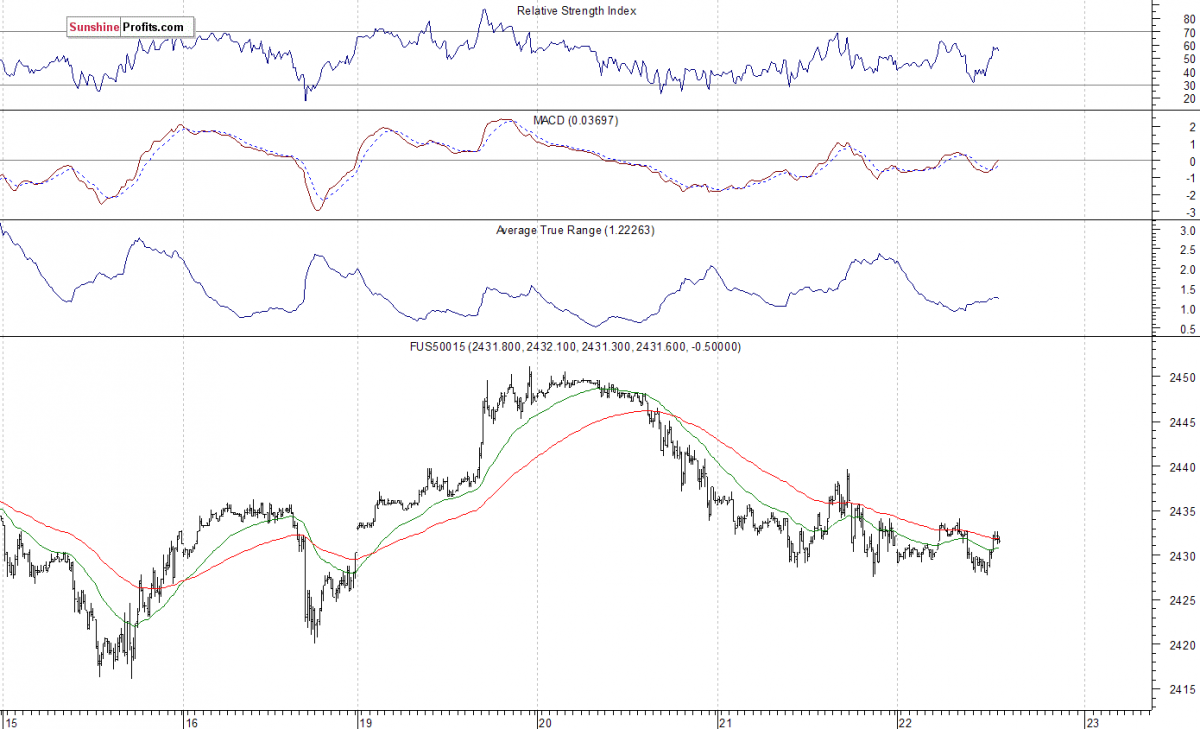
Expectations before the opening of today's trading session are virtually flat, with index futures currently between -0.05% and -0.1% vs. their Tuesday's closing prices. The European stock market indexes have lost 0.1-0.3% so far. Investors will now wait for some economic data announcements: Initial Claims number at 8:30 a.m., FHFA Housing Price Index at 9:00 a.m. The market expects that the Initial Claims were at 240,000 last week. The S&P 500 futures contract trades within an intraday consolidation, as it extends yesterday's fluctuations along the level of 2,430. The market bounced off resistance level at around 2,450, following Monday's rally to new record high. The nearest important level of resistance is at around 2,435-2,440, marked by short-term local highs. On the other hand, support level is at 2,425-2,430, marked by Monday's gap-up opening, among others. The next support level is at around 2,415-2,420, marked by recent local lows. The market extends its short-term consolidation, as it continues to trade along new record highs. Is this a topping pattern before downward reversal or just flat correction within an uptrend? There have been no confirmed negative signals so far.
Tech Stocks Rally
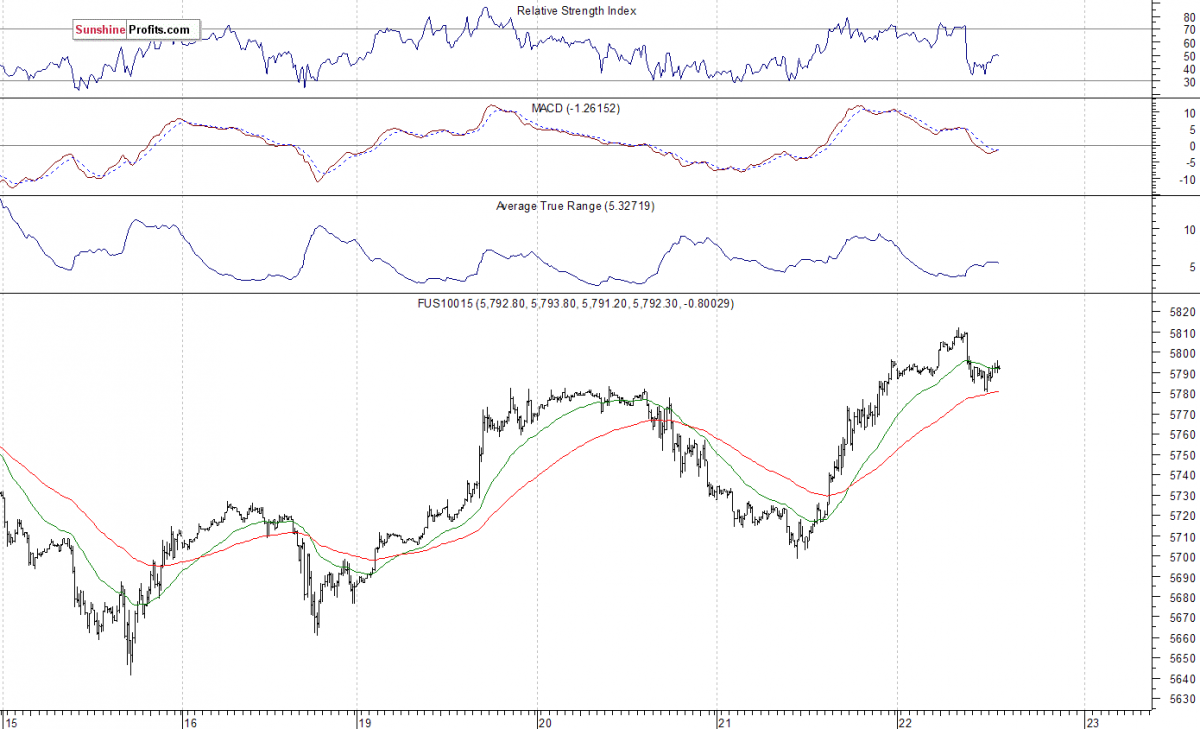
The technology Nasdaq 100 futures contract is relatively stronger, as it extends its yesterday's rally following better-than-expected quarterly earnings release from Oracle. It has retraced some more of June 9 sell-off yesterday. It is currently trading along the level of 5,790-5,810. The nearest important level of resistance is at around 5,810. The next resistance level is at 5,840-5,850, marked by some previous short-term local lows. On the other hand, support level is at around 5,780, marked by previous resistance level. The next support level is at 5,750-5,760, among others, as the 15-minute chart shows:
Concluding, the S&P 500 index remained basically unchanged on Wednesday, as technology stocks rallied retracing more of their June 9 sell-off. Will the broad stock market continue its uptrend? Or is this some topping pattern before more meaningful downward correction? There have been no confirmed negative signals so far. However, we still can see negative technical divergences, along with medium-term overbought conditions.
If you enjoyed the above analysis and would like to receive free follow-ups, we encourage you to sign up for our daily newsletter – it’s free and if you don’t like it, you can unsubscribe with just 2 clicks. If you sign up today, you’ll also get 7 days of free access to our premium daily Gold & Silver Trading Alerts. Sign up now.
Paul Rejczak
Stock Trading Strategist
* * * * *
Disclaimer
All essays, research and information found above represent analyses and opinions of Paul Rejczak and Sunshine Profits' associates only. As such, it may prove wrong and be a subject to change without notice. Opinions and analyses were based on data available to authors of respective essays at the time of writing. Although the information provided above is based on careful research and sources that are believed to be accurate, Paul Rejczak and his associates do not guarantee the accuracy or thoroughness of the data or information reported. The opinions published above are neither an offer nor a recommendation to purchase or sell any securities. Mr. Rejczak is not a Registered Securities Advisor. By reading Paul Rejczak’s reports you fully agree that he will not be held responsible or liable for any decisions you make regarding any information provided in these reports. Investing, trading and speculation in any financial markets may involve high risk of loss. Paul Rejczak, Sunshine Profits' employees and affiliates as well as members of their families may have a short or long position in any securities, including those mentioned in any of the reports or essays, and may make additional purchases and/or sales of those securities without notice.
More from Silver Phoenix 500


