More Uncertainty As Investors Await Quarterly Earnings Releases


In our opinion, speculative short positions are favored (with stop-loss at 2,410, and profit target at 2,200, S&P 500 index).
Our intraday outlook is bearish, and our short-term outlook is bearish. Our medium-term outlook remains neutral, following S&P 500 index breakout above last year's all-time high:
Intraday outlook (next 24 hours): bearish
Short-term outlook (next 1-2 weeks): bearish
Medium-term outlook (next 1-3 months): neutral
Long-term outlook (next year): neutral
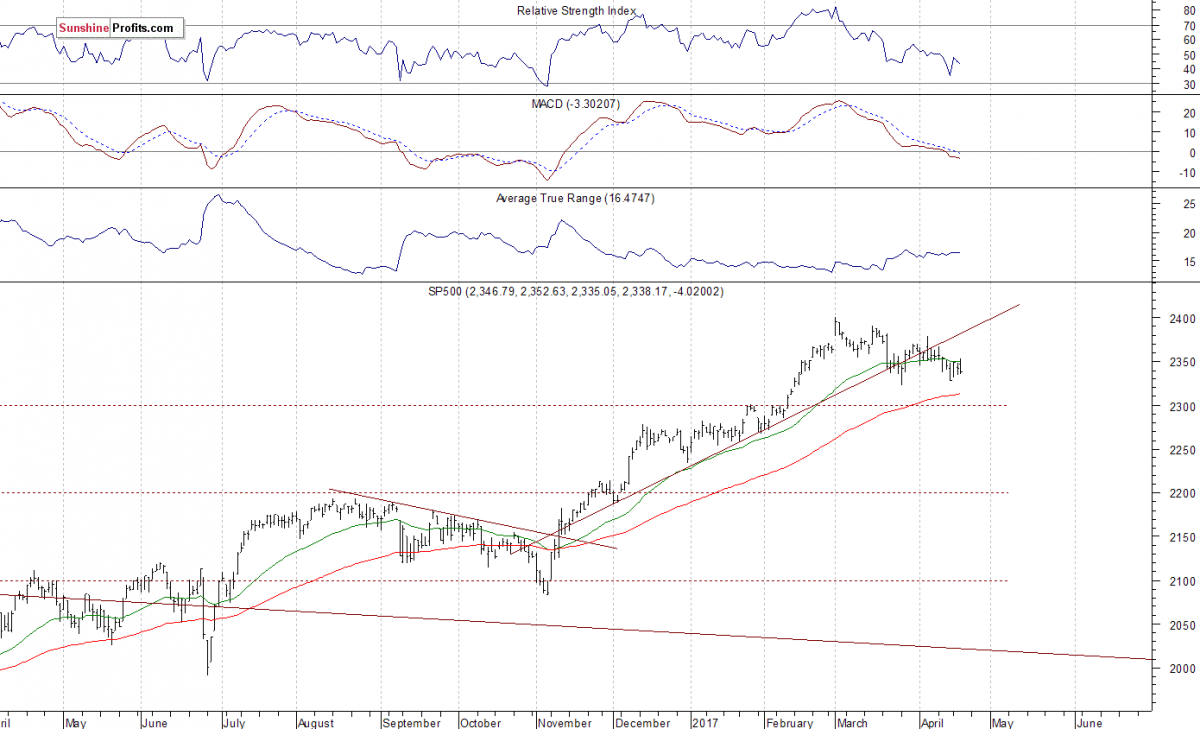
The U.S. stock market indexes were mixed between -0.6% and +0.2% on Wednesday, extending their short-term consolidation, as investors remained uncertain following last week's move down, among others. The S&P 500 index continues to trade along the level of 2,340-2,350. It is now trading around 2.5% below its March 1 all-time high of 2,400.98. Is this a new downtrend or just relatively shallow downward correction before another medium-term leg up? The Dow Jones Industrial Average fell closer to the level of 20,400, and relatively stronger technology Nasdaq Composite index got closer to 5,900 mark again. The nearest important level of support of the S&P 500 index is at around 2,320-2,330, marked by previous short-term consolidation. The next support level is at 2,270-2,280. The support level is also at around 2,250. On the other hand, the nearest important level of resistance is now at 2,350, marked by some recent local highs. The next resistance level is at 2,370-2,380, marked by the early April local highs. The resistance level is at also at around 2,400, marked by record high. We can see some short-term volatility following five-month-long rally off last year's November low at around 2,100. Is this a topping pattern before medium-term downward reversal? The uptrend accelerated on March 1 and it looked like a blow-off top pattern accompanied by some buying frenzy. The S&P 500 index is currently trading below its medium-term upward trend line, as we can see on the daily chart:
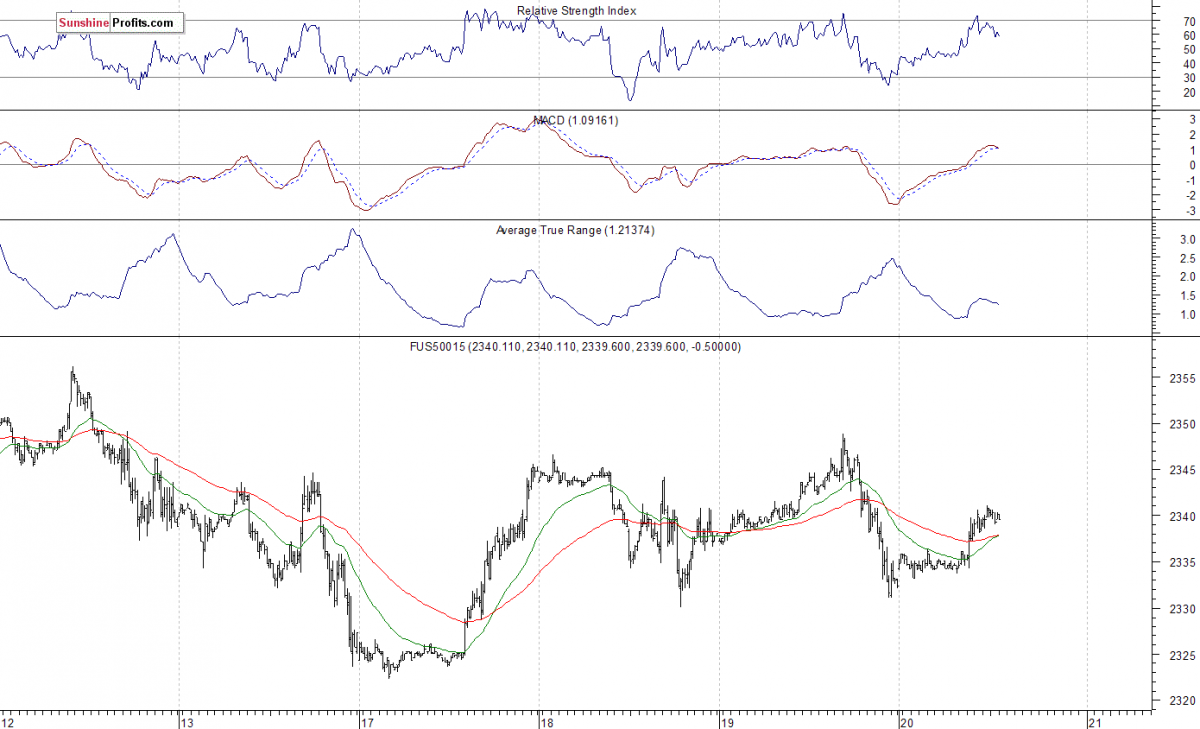
Expectations before the opening of today's trading session are positive, with index futures currently up 0.2-0.3%. The European stock markets have been mixed so far. Investors will now wait for some economic data announcements: Initial Claims, Philadelphia Fed at 8:30 a.m., Leading Indicators at 10:00 a.m. The market expects that the Philadelphia Fed number was at 23.7 in April, down from 32.8 in March. Investors will also wait for quarterly corporate earnings releases. The S&P 500 futures contract trades within an intraday uptrend, as it extends its short-term consolidation. The nearest important support level is at 2,320-2,330, marked by some short-term local lows. The next level of support is at around 2,300. On the other hand, the nearest important level of resistance is at around 2,340-2,350, marked by local highs. The resistance level is also at 2,370-2,375, marked by the early April local high. Will the market extend its move down? Or is this some short-term bottoming pattern before an upward reversal?
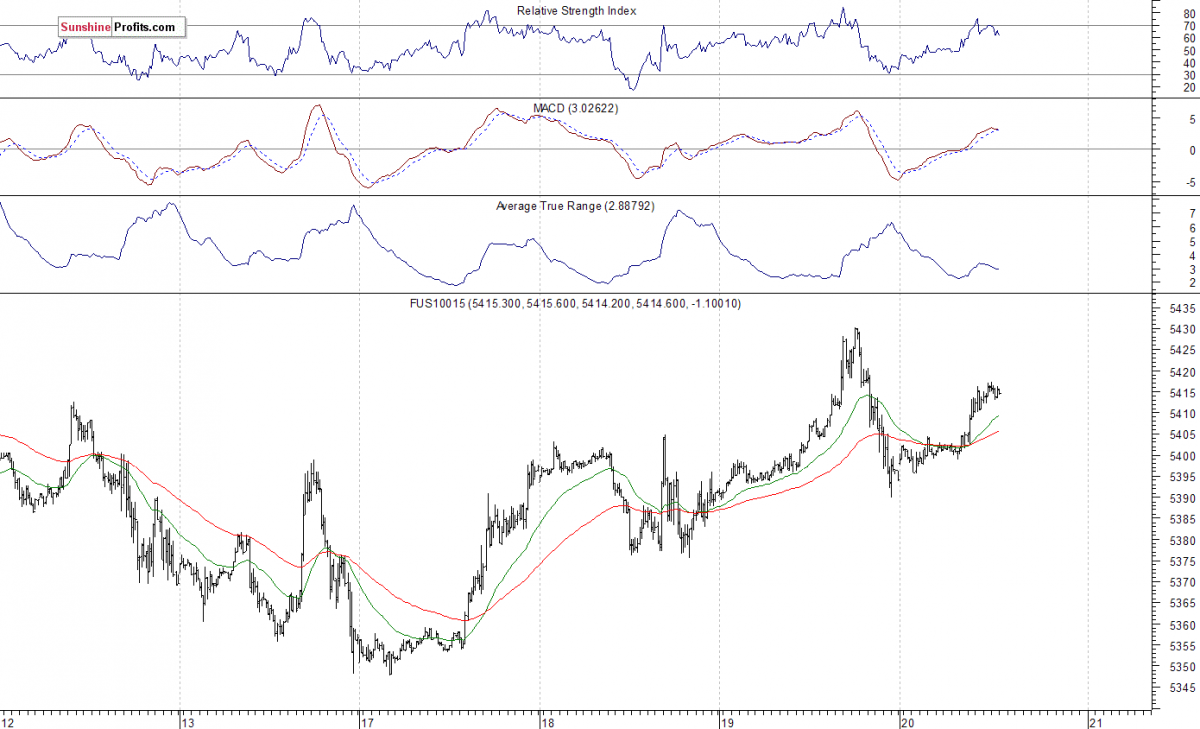
The technology Nasdaq 100 futures contract follows a similar path, as it currently trades within an intraday uptrend after yesterday's late session move down. It remains relatively stronger than the broad stock market, as it is just 1.2% below its early April record high. The nearest important support level is at around 5,380-5,400, marked previous level of resistance. The next level of support remains at 5,350-5,370, marked by short-term local lows. On the other hand, resistance level is at 5,420-5,440, marked by last week's local highs, as the 15-minute chart shows:
Concluding, the S&P 500 index extended its short-term fluctuations following Monday's rebound off support level at around 2,330. It has bounced off resistance level of 2,350 yesterday. Is this a new uptrend or just another upward correction? The broad stock market remains within an over-month-long consolidation following November-March rally. The index is currently trading below five-month-long medium-term upward trend line. There have been no confirmed short-term positive signals so far. However, we still can see medium-term negative technical divergences. Therefore, we continue to maintain our speculative short position (opened on February 15 at 2,335.58 - opening price of the S&P 500 index). Stop-loss level is at 2,410 and potential profit target is at 2,200 (S&P 500 index). You can trade S&P 500 index using futures contracts (S&P 500 futures contract - SP, E-mini S&P 500 futures contract - ES) or an ETF like the SPDR S&P 500 ETF - SPY. It is always important to set some exit price level in case some events cause the price to move in the unlikely direction. Having safety measures in place helps limit potential losses while letting the gains grow.
To summarize: short position in S&P 500 index is justified from the risk/reward perspective with the following entry prices, stop-loss orders and profit target price levels:
S&P 500 index - short position: profit target level: 2,200; stop-loss level: 2,410
S&P 500 futures contract (June) - short position: profit target level: 2,197; stop-loss level: 2,407
SPY ETF (SPDR S&P 500, not leveraged) - short position: profit target level: $220; stop-loss level: $241
SDS ETF (ProShares UltraShort S&P500, leveraged: -2x) - long position: profit target level: $15.47; stop-loss level: $12.98
More from Silver Phoenix 500


